the scatterplot below shows the relationship between the number of baseballs used in 14 games and the number…
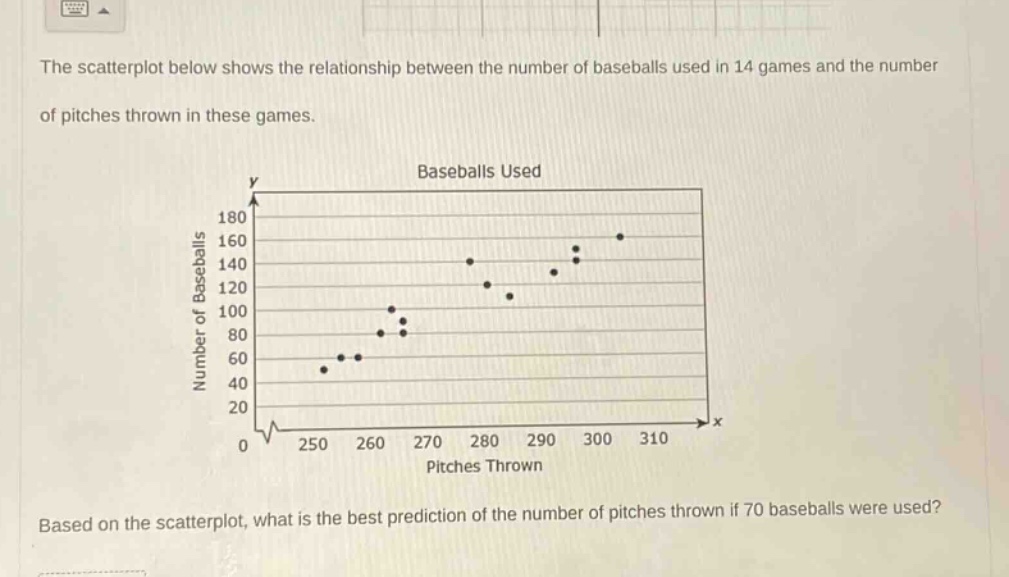
the scatterplot below shows the relationship between the number of baseballs used in 14 games and the number of pitches thrown in these games. based on the scatterplot, what is the best prediction of the number of pitches thrown if 70 baseballs were used?
Answer
Explanation:
Step1: Observe the scatter - plot trend
The scatter - plot shows a positive linear relationship between the number of pitches thrown and the number of baseballs used.
Step2: Locate 70 on the y - axis
We want to find the x - value (number of pitches) when y = 70 (number of baseballs).
Step3: Estimate the x - value
By looking at the scatter - plot and the trend of the data points, when the number of baseballs (y) is 70, we can estimate the number of pitches (x) by drawing an imaginary horizontal line from y = 70 to the trend of the data points and then a vertical line down to the x - axis. It appears that when y = 70, x is approximately 260.
Answer:
260