the scatterplot below shows the relationship between the number of sunny days and the number of rainy days…
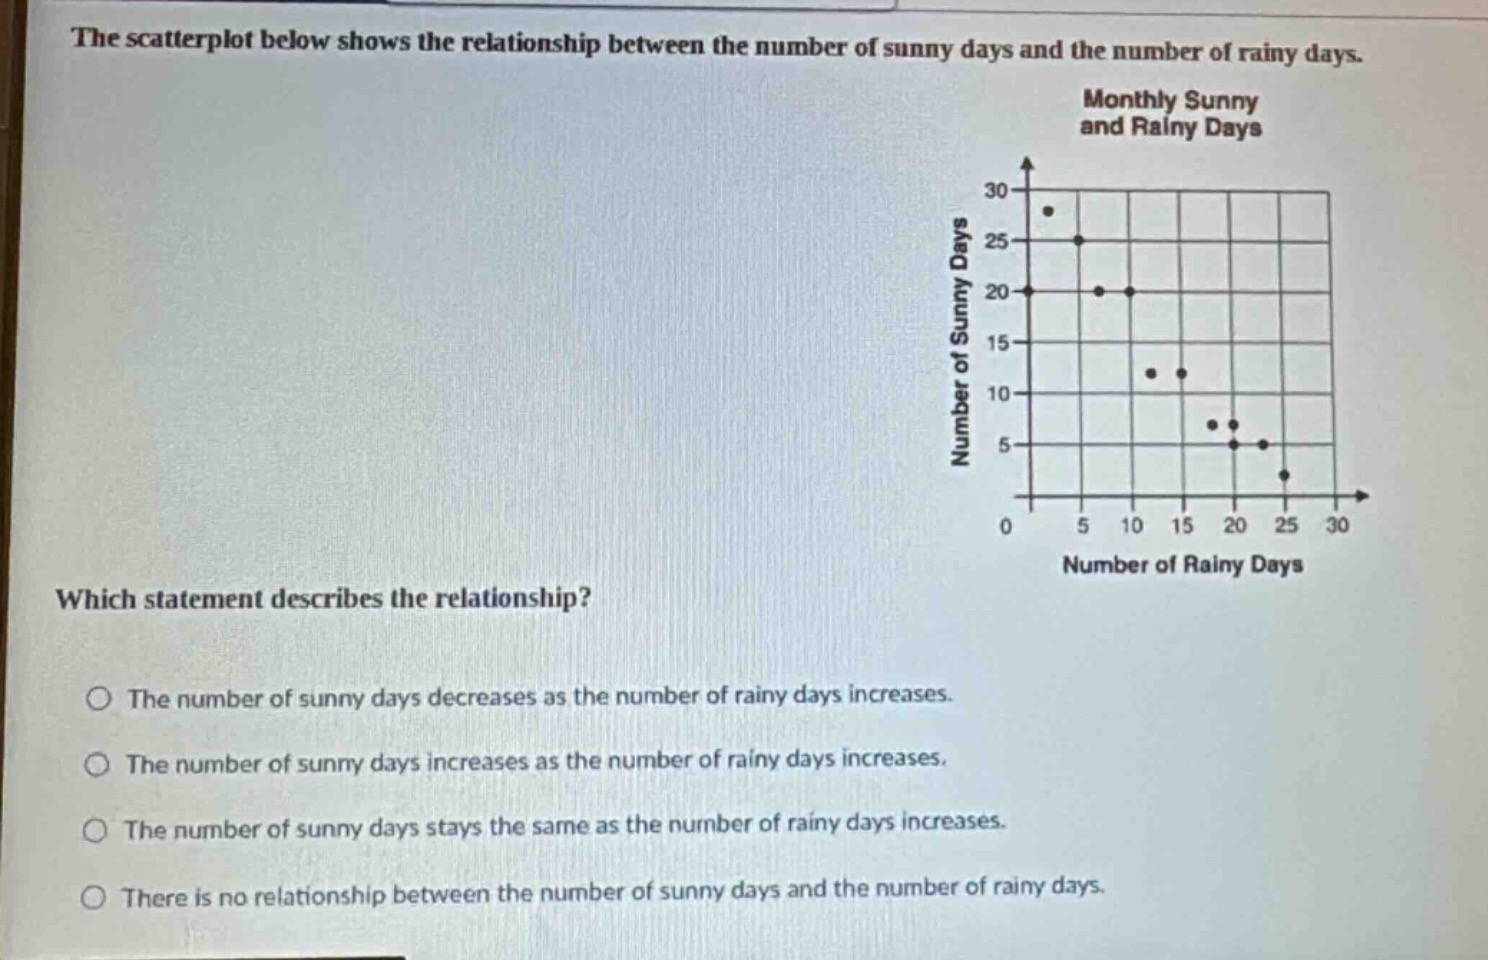
the scatterplot below shows the relationship between the number of sunny days and the number of rainy days. which statement describes the relationship? the number of sunny days decreases as the number of rainy days increases. the number of sunny days increases as the number of rainy days increases. the number of sunny days stays the same as the number of rainy days increases. there is no relationship between the number of sunny days and the number of rainy days.
Answer
Explanation:
Step1: Observe the scatter - plot trend
As the value on the x - axis (number of rainy days) increases, the value on the y - axis (number of sunny days) generally decreases.
Answer:
The number of sunny days decreases as the number of rainy days increases.