2. the scatterplot shows the relationship between the time spent in minutes at a restaurant and the amount…
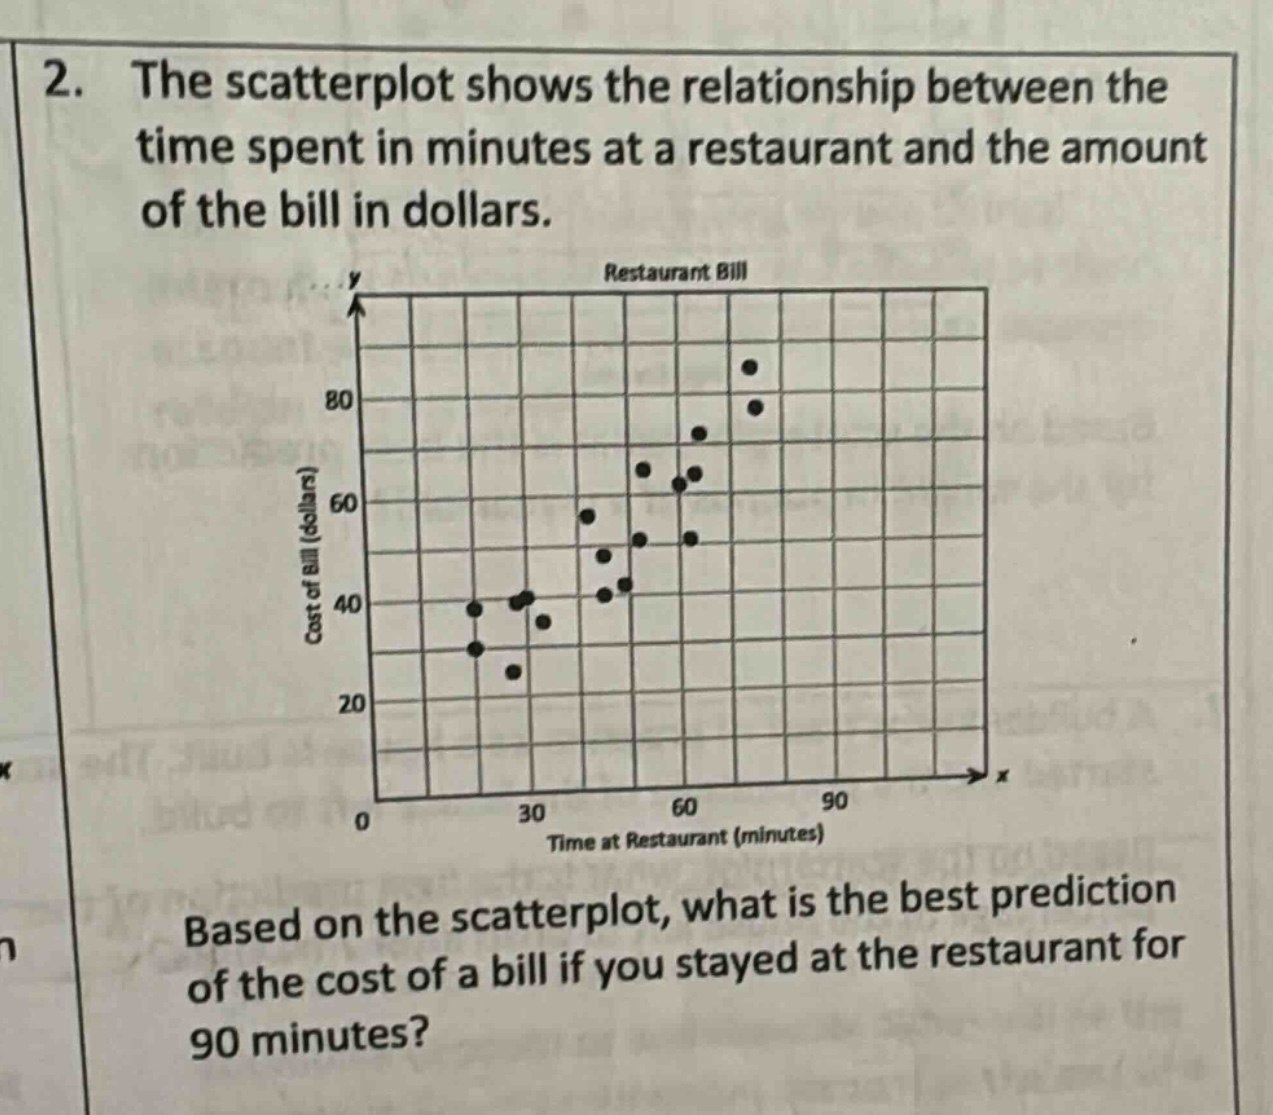
2. the scatterplot shows the relationship between the time spent in minutes at a restaurant and the amount of the bill in dollars. based on the scatterplot, what is the best prediction of the cost of a bill if you stayed at the restaurant for 90 minutes?
Answer
Explanation:
Step1: Observe the trend
As the time increases, the bill amount generally increases.
Step2: Estimate from the scatter - plot
Looking at the points and the general upward - trend, when (x = 90) minutes, by visually extending the trend of the data points, we can estimate the (y) - value (cost of bill). The points seem to follow a somewhat linear upward trend. The data points cluster around a line that would suggest a value around 80 dollars when (x = 90).
Answer:
80 dollars