the scatterplot shows the relationship between two variables, x and y. a line of best fit for the data is…
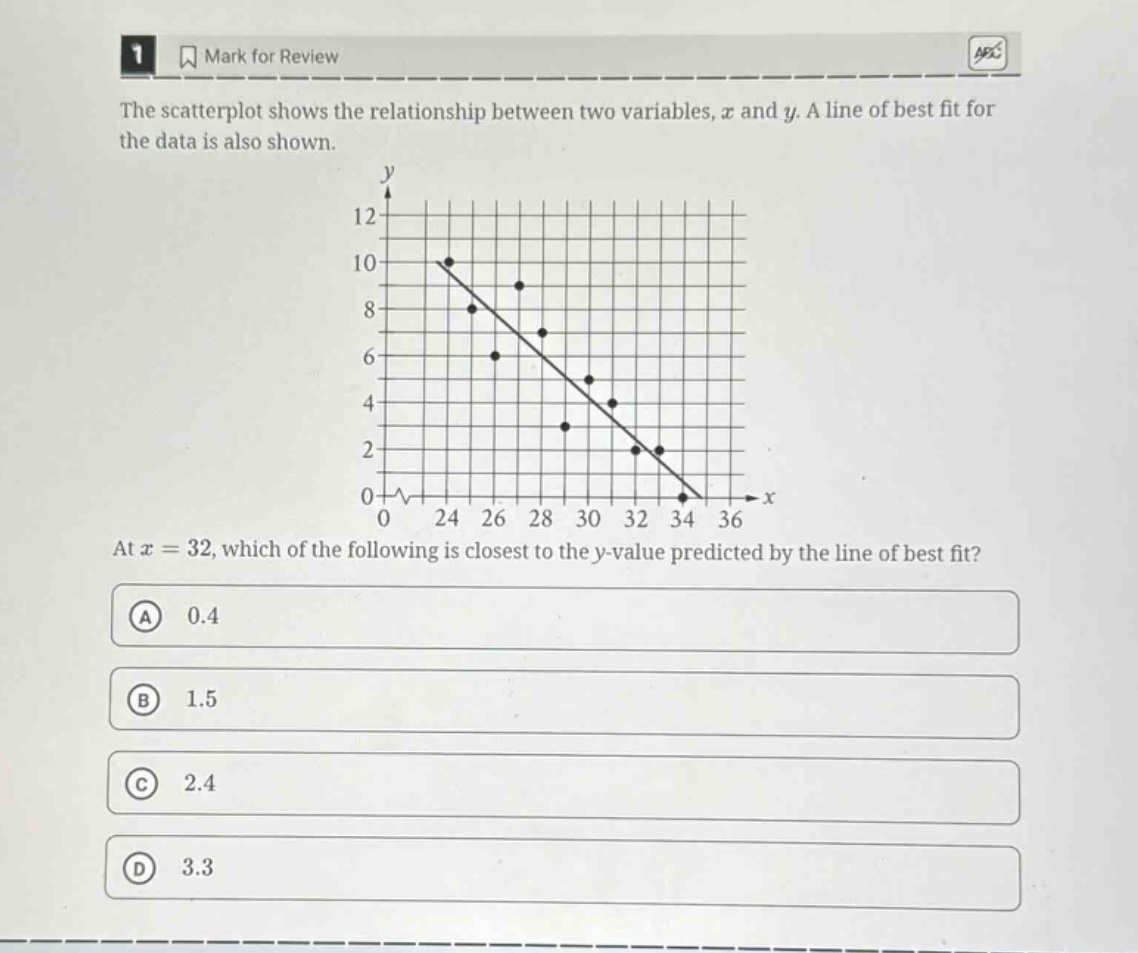
the scatterplot shows the relationship between two variables, x and y. a line of best fit for the data is also shown. at x = 32, which of the following is closest to the y - value predicted by the line of best fit? a 0.4 b 1.5 c 2.4 d 3.3
Answer
Explanation:
Step1: Identify two points on line
Choose two points on the line of best - fit, say $(24,10)$ and $(34,0)$.
Step2: Calculate slope
The slope $m$ of the line using the formula $m=\frac{y_2 - y_1}{x_2 - x_1}$ is $m=\frac{0 - 10}{34 - 24}=\frac{- 10}{10}=-1$.
Step3: Find y - intercept
Using the point - slope form $y - y_1=m(x - x_1)$ with the point $(34,0)$ and $m=-1$, we get $y-0=-1(x - 34)$, so the equation of the line is $y=-x + 34$.
Step4: Predict y - value
Substitute $x = 32$ into the equation $y=-x + 34$. Then $y=-32 + 34=2$. The value closest to 2 among the options is 2.4.
Answer:
C. 2.4