which scatterplot shows the strongest positive correlation coefficient?
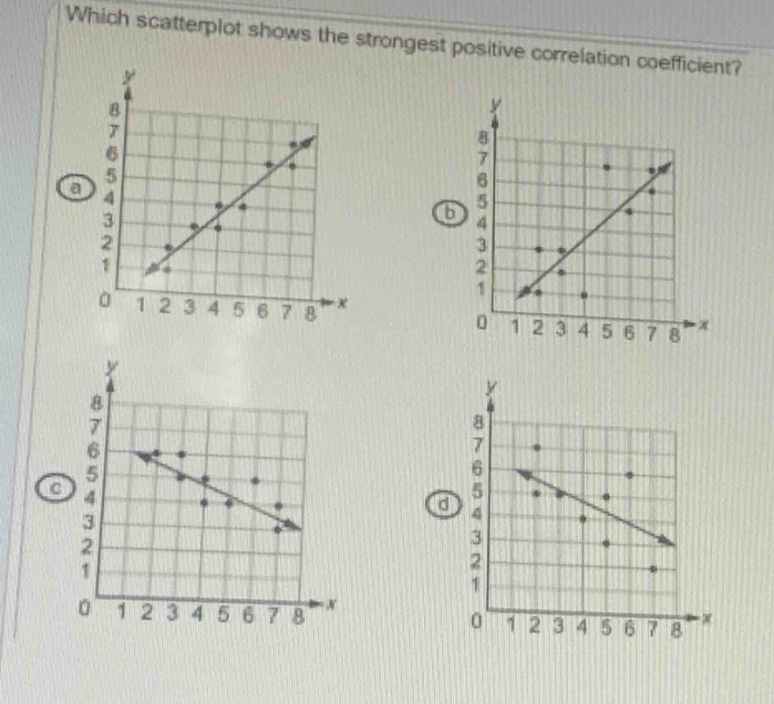
which scatterplot shows the strongest positive correlation coefficient?
Answer
Explanation:
Step1: Recall positive - correlation concept
Positive correlation means as $x$ increases, $y$ increases. Scatter - plots (c) and (d) show negative correlation as $y$ decreases when $x$ increases, so we can eliminate them.
Step2: Assess strength of positive correlation
The closer the data points are to a straight - line, the stronger the correlation. In scatter - plot (a), the data points are closer to the line of best fit compared to scatter - plot (b).
Answer:
A. The scatterplot in option (a)