the scatterplot shows the time driven on a trip compared to the distance driven. inspect the scatterplot to…
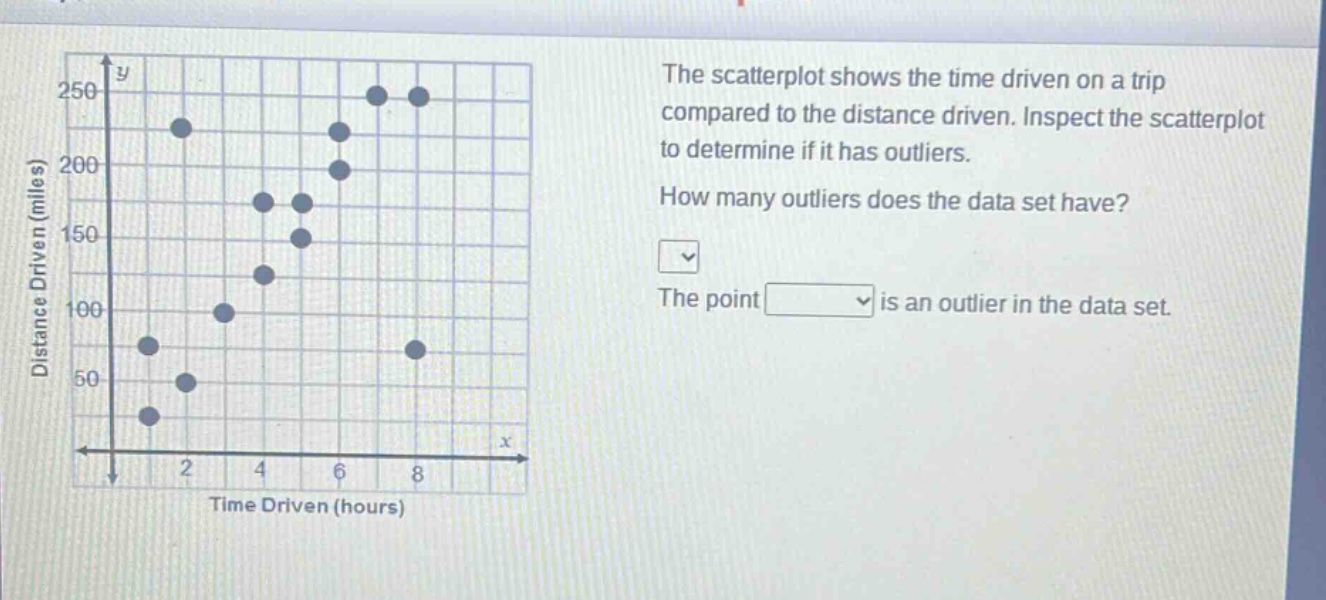
the scatterplot shows the time driven on a trip compared to the distance driven. inspect the scatterplot to determine if it has outliers. how many outliers does the data set have? the point is an outlier in the data set.
Answer
Explanation:
Step1: Identify outliers visually
Outliers are points that are far - removed from the general pattern of the data. Looking at the scatter - plot, most of the points seem to follow a somewhat linear upward trend. The point that is far below the general pattern is the outlier.
Step2: Count outliers
There is 1 point that stands out as being different from the rest of the data points.
Answer:
1; The point with a relatively low distance for a given time value (the point near the bottom - left that is separated from the main cluster) is an outlier in the data set.