a scatterplot is used to display data for a runner where x is the number of miles run, and y is the time, in…
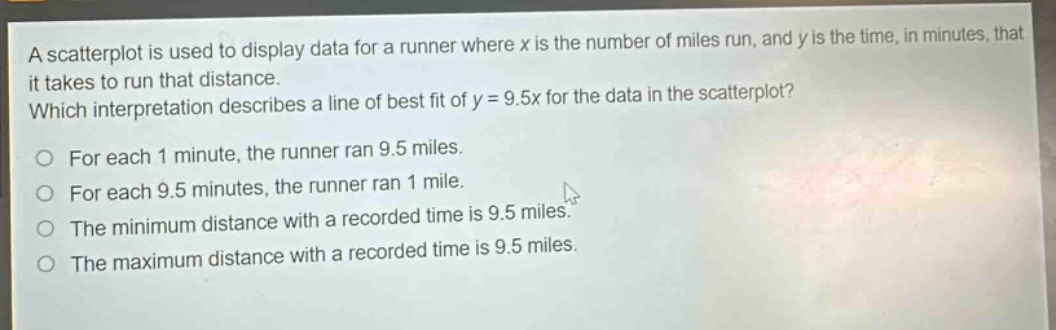
a scatterplot is used to display data for a runner where x is the number of miles run, and y is the time, in minutes, that it takes to run that distance. which interpretation describes a line of best fit of y = 9.5x for the data in the scatterplot? for each 1 minute, the runner ran 9.5 miles. for each 9.5 minutes, the runner ran 1 mile. the minimum distance with a recorded time is 9.5 miles. the maximum distance with a recorded time is 9.5 miles.
Answer
Brief Explanations:
The equation of the line of best - fit is $y = 9.5x$, where $y$ is time in minutes and $x$ is miles. This means for every 1 mile ($x$ increases by 1), the time $y$ increases by 9.5 minutes. In other words, for each 1 mile, the runner takes 9.5 minutes or for each 9.5 minutes, the runner ran 1 mile.
Answer:
For each 9.5 minutes, the runner ran 1 mile.