a school conducts a recipe contest in which 1 student gets first place, 1 student gets second place, 1…
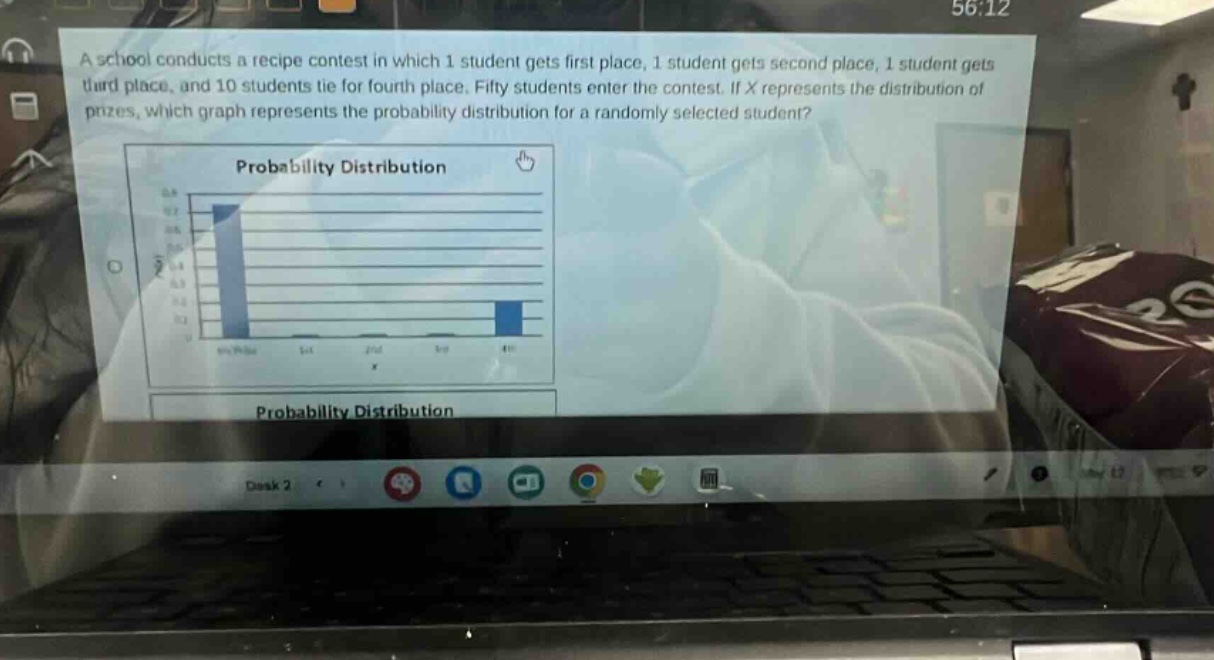
a school conducts a recipe contest in which 1 student gets first place, 1 student gets second place, 1 student gets third place, and 10 students tie for fourth place. fifty students enter the contest. if x represents the distribution of prizes, which graph represents the probability distribution for a randomly selected student? probability distribution probability distribution
Answer
Explanation:
Step1: Calculate probability of first - place
There is 1 first - place winner out of 50 students. So the probability $P(1st)=\frac{1}{50}=0.02$.
Step2: Calculate probability of second - place
There is 1 second - place winner out of 50 students. So the probability $P(2nd)=\frac{1}{50}=0.02$.
Step3: Calculate probability of third - place
There is 1 third - place winner out of 50 students. So the probability $P(3rd)=\frac{1}{50}=0.02$.
Step4: Calculate probability of fourth - place
There are 10 fourth - place winners out of 50 students. So the probability $P(4th)=\frac{10}{50}=0.2$.
Step5: Calculate probability of no - prize
The number of students with no prize is $50-(1 + 1+1 + 10)=37$. So the probability $P(no - prize)=\frac{37}{50}=0.74$.
The graph should have bars at the positions corresponding to first, second, third, and fourth places with heights 0.02, 0.02, 0.02, and 0.2 respectively, and a bar for no - prize with height 0.74. But since no options for graphs are given, we have calculated the probabilities for the distribution.
Answer:
Probabilities are: $P(1st) = 0.02$, $P(2nd)=0.02$, $P(3rd)=0.02$, $P(4th)=0.2$, $P(no - prize)=0.74$