a school district wanted to compare act scores between two of its schools (school a and school b). the…
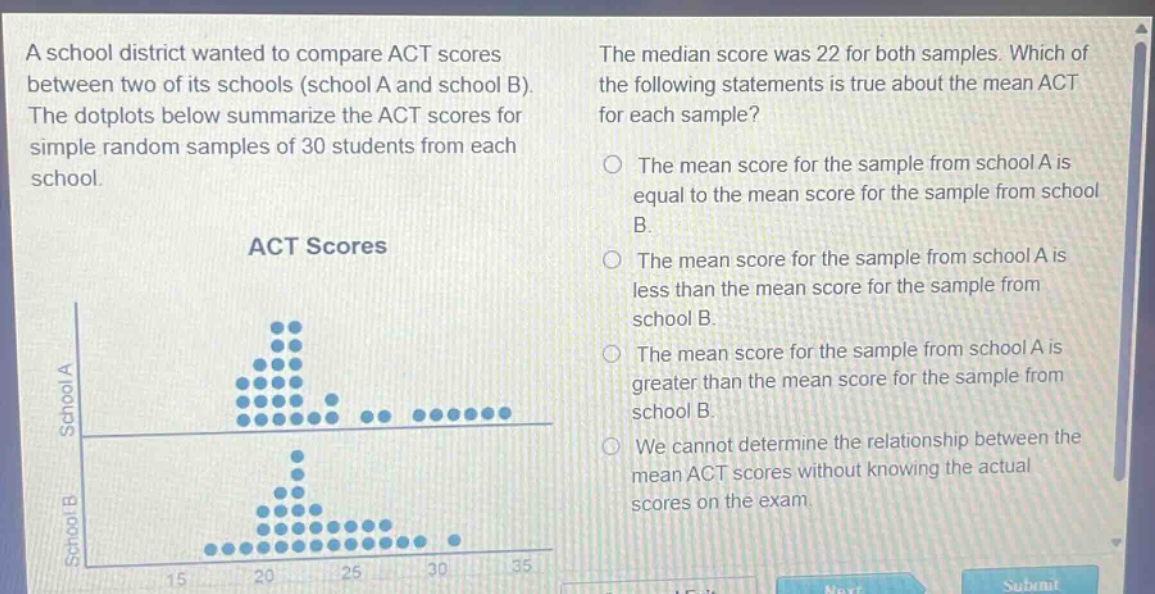
a school district wanted to compare act scores between two of its schools (school a and school b). the dotplots below summarize the act scores for simple random samples of 30 students from each school. the median score was 22 for both samples. which of the following statements is true about the mean act for each sample? the mean score for the sample from school a is equal to the mean score for the sample from school b. the mean score for the sample from school a is less than the mean score for the sample from school b. the mean score for the sample from school a is greater than the mean score for the sample from school b. we cannot determine the relationship between the mean act scores without knowing the actual scores on the exam.
Answer
Explanation:
Step1: Observe the dot - plots
In the dot - plot of school A, there are more high - value outliers (scores around 30 - 35) compared to school B. The median is the same for both samples (22). The mean is affected by outliers.
Step2: Analyze the effect of outliers on the mean
Outliers increase the sum of the data values. Since school A has more high - value outliers, the sum of the ACT scores for the sample from school A will be larger than that of school B for the same sample size (n = 30). Using the formula for the mean $\bar{x}=\frac{\sum_{i = 1}^{n}x_{i}}{n}$, with n being the same for both samples, a larger sum $\sum_{i = 1}^{n}x_{i}$ for school A will result in a larger mean.
Answer:
The mean score for the sample from school A is greater than the mean score for the sample from school B.