the schools guidance department compares the grade - point averages and standardized state test scores for…
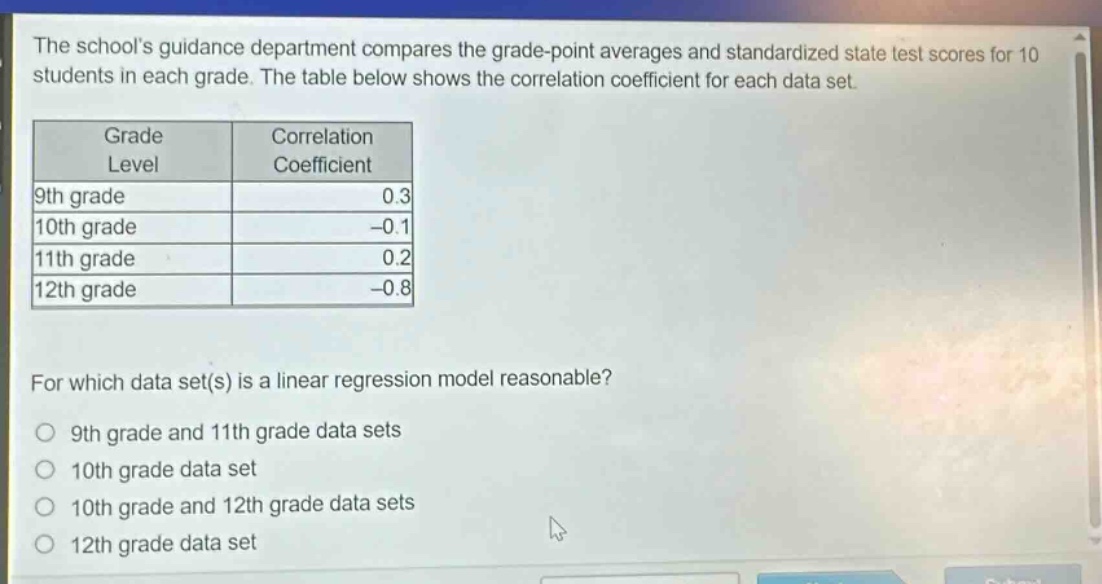
the schools guidance department compares the grade - point averages and standardized state test scores for 10 students in each grade. the table below shows the correlation coefficient for each data set.\n| grade level | correlation coefficient |\n| ---- | ---- |\n| 9th grade | 0.3 |\n| 10th grade | -0.1 |\n| 11th grade | 0.2 |\n| 12th grade | -0.8 |\n\nfor which data set(s) is a linear regression model reasonable?\no 9th grade and 11th grade data sets\no 10th grade data set\no 10th grade and 12th grade data sets\no 12th grade data set
Answer
Explanation:
Step1: Recall correlation - coefficient rule
A linear regression model is reasonable when the absolute value of the correlation coefficient ($r$) is close to 1.
Step2: Analyze each grade - level correlation coefficient
For 9th grade, $|r| = |0.3| = 0.3$. For 10th grade, $|r|=|- 0.1| = 0.1$. For 11th grade, $|r| = |0.2| = 0.2$. For 12th grade, $|r|=|-0.8| = 0.8$.
Step3: Determine the reasonable data - set
Since 0.8 is the closest to 1 among the given correlation coefficients, a linear regression model is reasonable for the 12th - grade data set.
Answer:
12th grade data set