here are the scores of 16 students on a history test. 57, 59, 60, 62, 65, 66, 67, 69, 69, 77, 84, 84, 85…
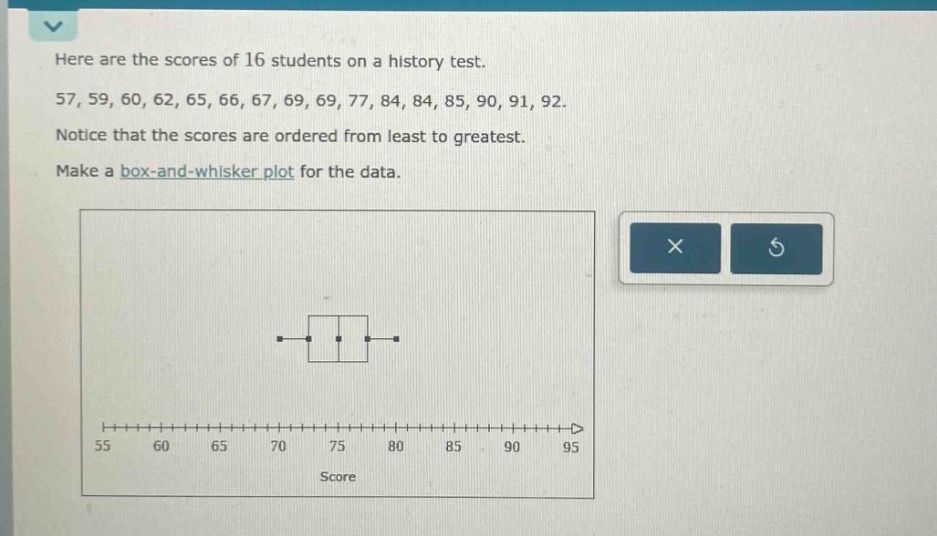
here are the scores of 16 students on a history test. 57, 59, 60, 62, 65, 66, 67, 69, 69, 77, 84, 84, 85, 90, 91, 92. notice that the scores are ordered from least to greatest. make a box - and - whisker plot for the data.
Answer
Explanation:
Step1: Find the minimum value
The minimum value of the data - set $57,59,60,62,65,66,67,69,69,77,84,84,85,90,91,92$ is $57$.
Step2: Find the first - quartile ($Q_1$)
The data - set has $n = 16$ data points. The lower half of the data set consists of the first 8 values: $57,59,60,62,65,66,67,69$. The median of the lower half (first - quartile) is $\frac{62 + 65}{2}=63.5$.
Step3: Find the median ($Q_2$)
Since $n = 16$ (an even number of data points), the median is the average of the 8th and 9th ordered values. The 8th value is $69$ and the 9th value is $69$, so the median $Q_2=\frac{69 + 69}{2}=69$.
Step4: Find the third - quartile ($Q_3$)
The upper half of the data set consists of the last 8 values: $77,84,84,85,90,91,92$. The median of the upper half (third - quartile) is $\frac{84+85}{2}=84.5$.
Step5: Find the maximum value
The maximum value of the data - set is $92$.
Answer:
On the box - and - whisker plot:
- The left - most point (whisker) is at $57$.
- The left - hand side of the box is at $Q_1 = 63.5$.
- The line inside the box is at the median $Q_2 = 69$.
- The right - hand side of the box is at $Q_3 = 84.5$.
- The right - most point (whisker) is at $92$.