the scores for todays math quiz are 75, 95, 60, 75, 95, and 80. explain the steps needed to create a…
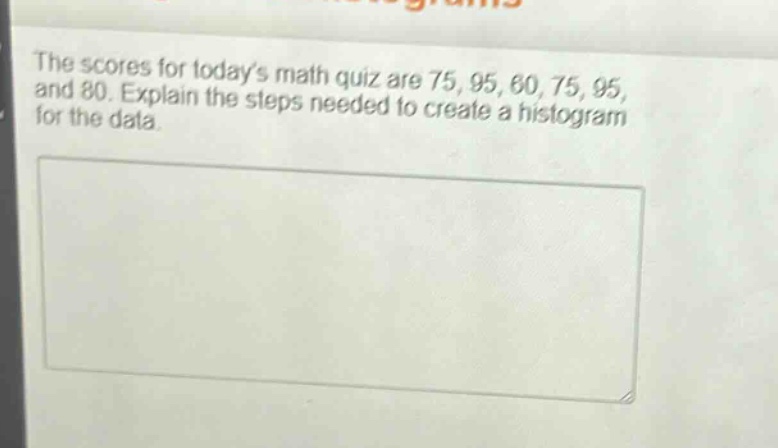
the scores for todays math quiz are 75, 95, 60, 75, 95, and 80. explain the steps needed to create a histogram for the data.
Answer
Explanation:
Step1: Determine data range
The lowest score is 60 and the highest is 95. The range is $95 - 60=35$.
Step2: Decide on number of bins
A common choice could be 5 bins. So the bin - width would be $\frac{35}{5}=7$. We can use bins like 60 - 66, 67 - 73, 74 - 80, 81 - 87, 88 - 94, 95 - 101.
Step3: Tally the data
Count how many scores fall into each bin. For example, for the bin 60 - 66, there is 1 score (60). For 74 - 80, there are 3 scores (75, 75, 80), etc.
Step4: Draw the histogram
On the x - axis, label the bins. On the y - axis, label the frequency (number of scores in each bin). Draw bars for each bin with heights corresponding to the frequency of scores in that bin.
Answer:
Follow the above four - step process to create the histogram.