scott spins this spinner once. which tree - diagram represents the sample space of this event?
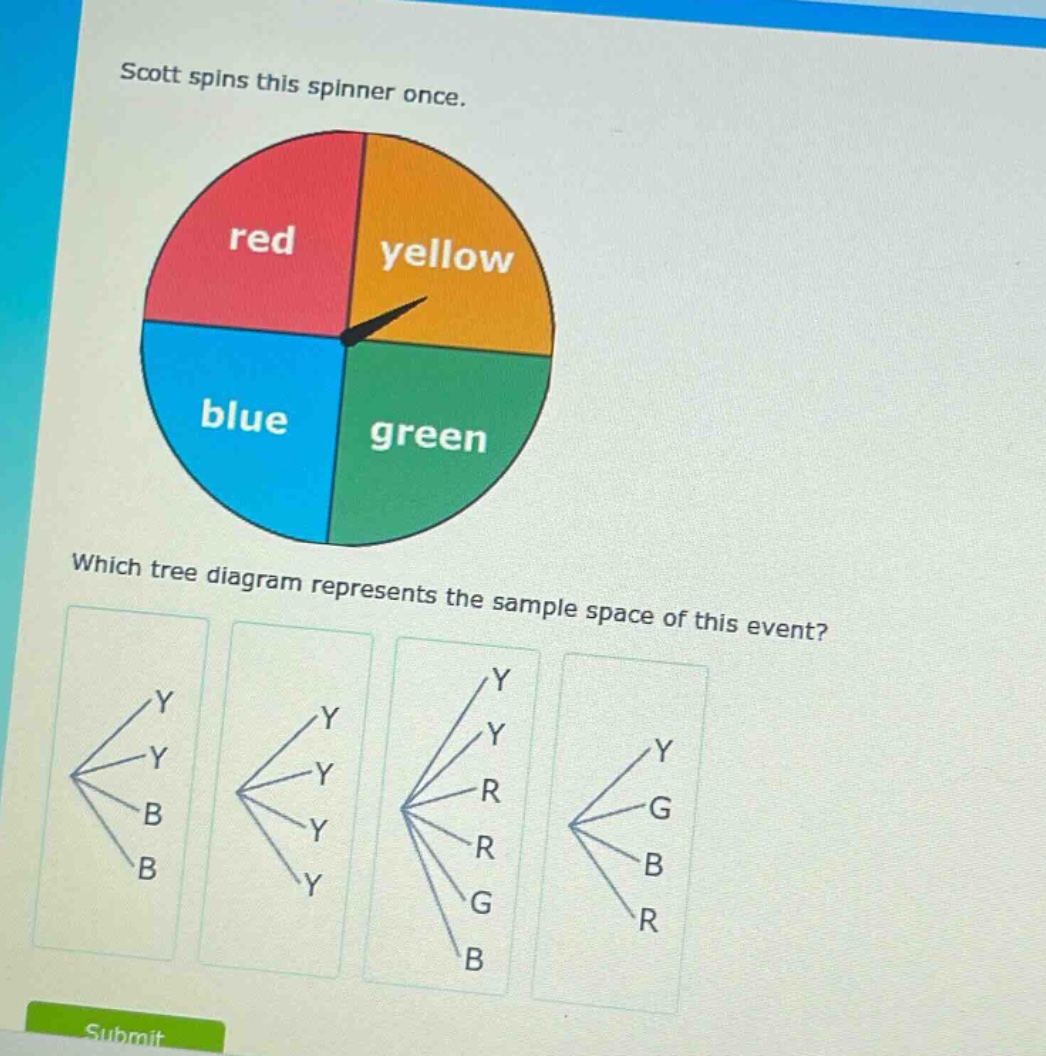
scott spins this spinner once. which tree - diagram represents the sample space of this event?
Answer
Answer:
The tree - diagram with branches labeled Y (yellow), R (red), G (green), B (blue) starting from a single point represents the sample space. Looking at the options, the one with branches Y, R, G, B is the correct one. Without specific labels for the options, we can't give an option identifier like A, B, etc., but conceptually, the tree - diagram that has one branch for each of the four colors (yellow, red, green, blue) is the answer.
Explanation:
Step1: Identify sample space elements
The spinner has 4 colors: red (R), yellow (Y), green (G), blue (B).
Step2: Match with tree - diagram structure
A tree - diagram for this single - spin event should have 4 branches, one for each color.