a scout leader counted how many badges each scout had earned. badges earned: 4 9 5 6 8 9 9 10 4 10 5. which…
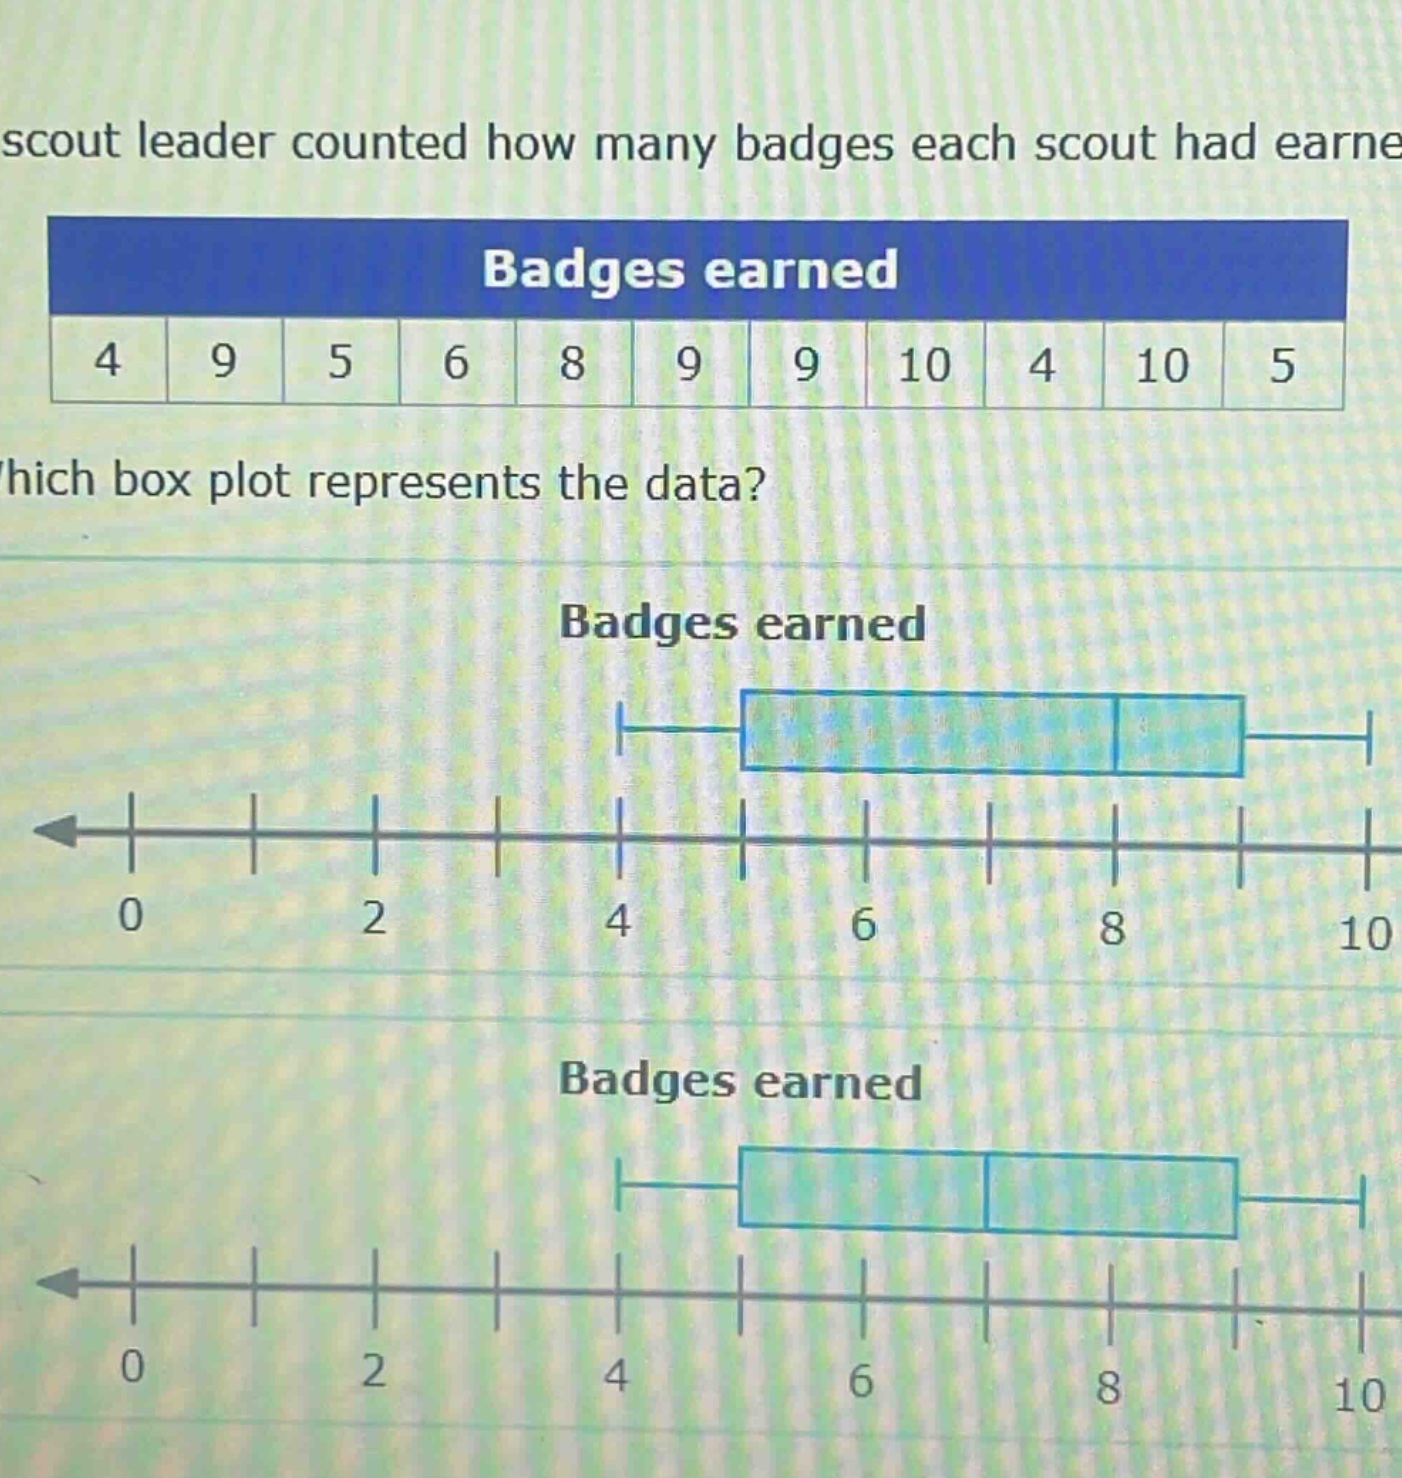
a scout leader counted how many badges each scout had earned. badges earned: 4 9 5 6 8 9 9 10 4 10 5. which box plot represents the data? badges earned badges earned
Answer
Explanation:
Step1: Arrange data in ascending order
4, 4, 5, 5, 6, 8, 9, 9, 9, 10, 10
Step2: Find the median (Q2)
There are 11 data - points. The median is the 6th value, so Q2 = 8.
Step3: Find the lower half of data
4, 4, 5, 5, 6. The median of the lower half (Q1) is 5.
Step4: Find the upper half of data
9, 9, 9, 10, 10. The median of the upper half (Q3) is 9.
Step5: Identify the minimum and maximum
The minimum value is 4 and the maximum value is 10.
A box - plot has a box from Q1 to Q3 with a line at Q2, and whiskers from the minimum to Q1 and from Q3 to the maximum. So the box should start at 5, end at 9 with a line at 8, and whiskers from 4 to 5 and from 9 to 10.
Answer:
The box - plot with the box starting at 5, ending at 9, a line inside the box at 8, and whiskers extending to 4 and 10.