in which section of the box plot are the data most spread out? from the minimum to the lower quartile from…
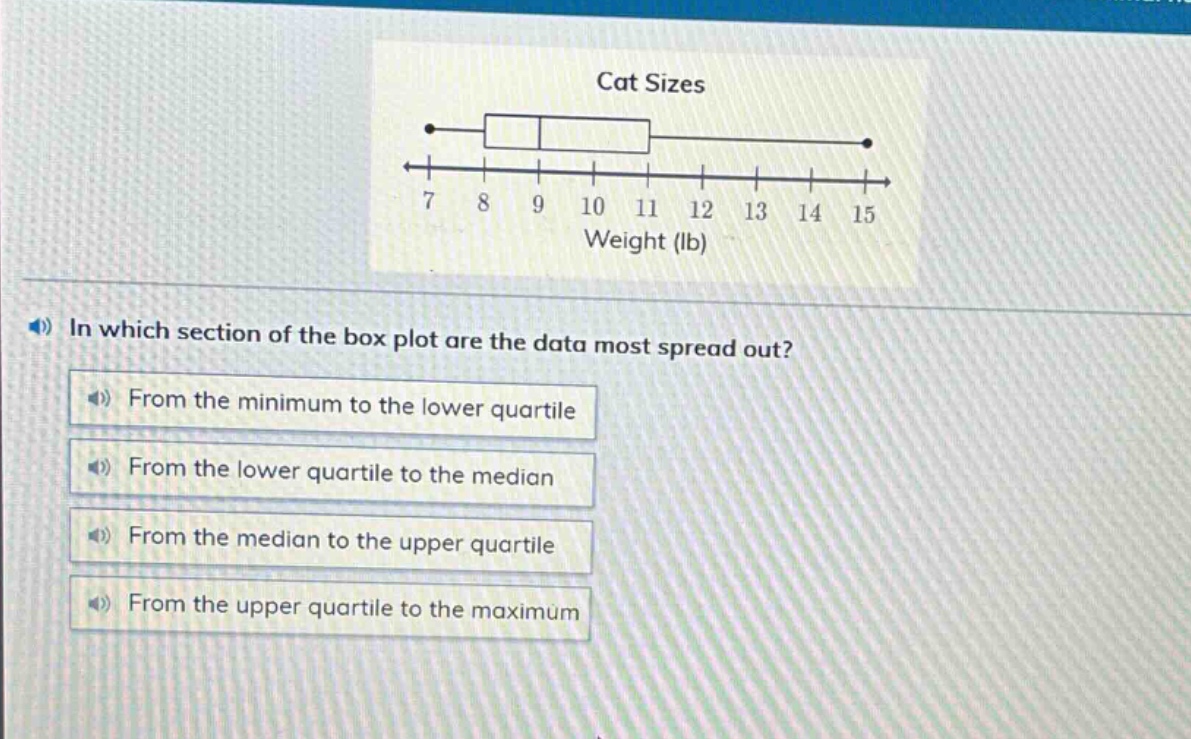
in which section of the box plot are the data most spread out? from the minimum to the lower quartile from the lower quartile to the median from the median to the upper quartile from the upper quartile to the maximum
Answer
Answer:
D. From the upper quartile to the maximum
Explanation:
Step1: Measure spread in box - plot
The spread is measured by the length of each section.
Step2: Calculate lengths of sections
- Minimum to lower quartile: (8 - 7=1)
- Lower quartile to median: (9 - 8 = 1)
- Median to upper quartile: (11 - 9=2)
- Upper quartile to maximum: (15 - 11 = 4)
Step3: Compare lengths
The largest length is from the upper quartile to the maximum, so the data is most spread out in this section.