a 4 - section spinner is spun 2 times. each of the sections are the same size. the set of possible outcomes…
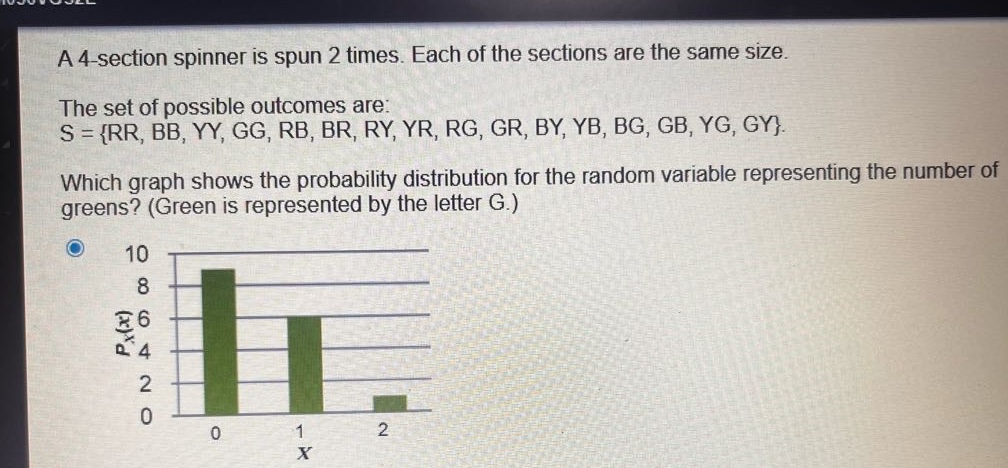
a 4 - section spinner is spun 2 times. each of the sections are the same size. the set of possible outcomes are: s = {rr, bb, yy, gg, rb, br, ry, yr, rg, gr, by, yb, bg, gb, yg, gy}. which graph shows the probability distribution for the random variable representing the number of greens? (green is represented by the letter g.)
Answer
Explanation:
Step1: Calculate total number of outcomes
The spinner is spun 2 times and has 4 - section each time. So the total number of outcomes is $4\times4 = 16$.
Step2: Calculate number of 0 greens
Count the outcomes with no G: {RR, BB, YY, RB, BR, RY, YR, BY, YB}, there are 9 outcomes. So $P(X = 0)=\frac{9}{16}$.
Step3: Calculate number of 1 green
Count the outcomes with one G: {RG, GR, BG, GB, YG, GY}, there are 6 outcomes. So $P(X = 1)=\frac{6}{16}=\frac{3}{8}$.
Step4: Calculate number of 2 greens
Count the outcomes with two G: {GG}, there is 1 outcome. So $P(X = 2)=\frac{1}{16}$.
Answer:
We need to check which graph has $P(X = 0)=\frac{9}{16}$, $P(X = 1)=\frac{3}{8}$, $P(X = 2)=\frac{1}{16}$. Since $\frac{9}{16}=0.5625$, $\frac{3}{8} = 0.375$, $\frac{1}{16}=0.0625$. But without seeing all the graph - options, we can't exactly pick the right one. However, the correct probabilities for the number of greens are $P(X = 0)=\frac{9}{16}$, $P(X = 1)=\frac{6}{16}$, $P(X = 2)=\frac{1}{16}$.