to see what might be happening when we regroup data, consider an experiment that takes 12 subjects and…
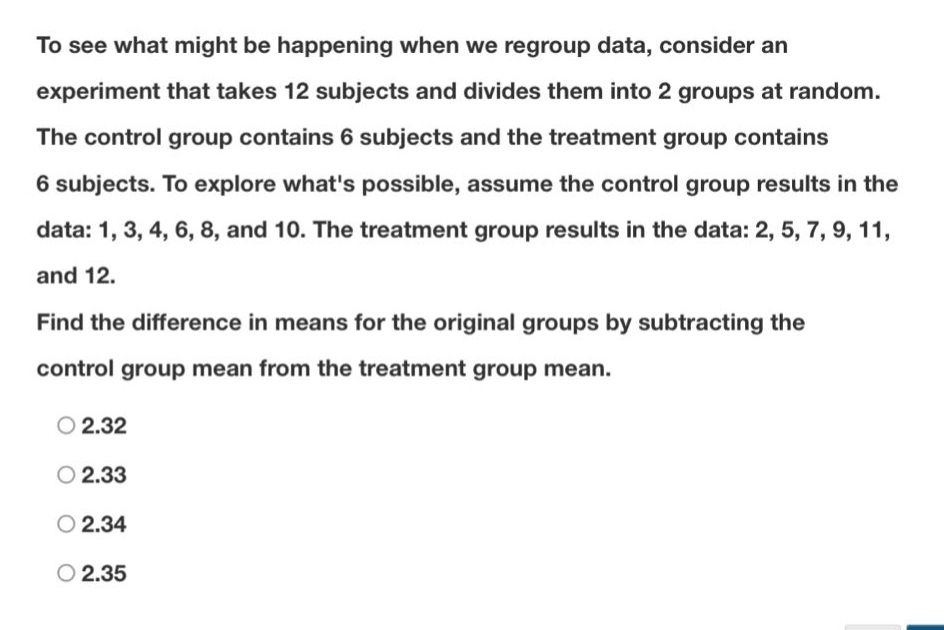
to see what might be happening when we regroup data, consider an experiment that takes 12 subjects and divides them into 2 groups at random. the control group contains 6 subjects and the treatment group contains 6 subjects. to explore whats possible, assume the control group results in the data: 1, 3, 4, 6, 8, and 10. the treatment group results in the data: 2, 5, 7, 9, 11, and 12. find the difference in means for the original groups by subtracting the control group mean from the treatment group mean. 2.32 2.33 2.34 2.35
Answer
Explanation:
Step1: Calculate control - group mean
The formula for the mean $\bar{x}=\frac{\sum_{i = 1}^{n}x_{i}}{n}$. For the control group with data $1,3,4,6,8,10$ and $n = 6$, $\sum_{i=1}^{6}x_{i}=1 + 3+4+6+8+10=32$. So the control - group mean $\bar{x}_{1}=\frac{32}{6}=\frac{16}{3}$.
Step2: Calculate treatment - group mean
For the treatment group with data $2,5,7,9,11,12$ and $n = 6$, $\sum_{i = 1}^{6}x_{i}=2 + 5+7+9+11+12=46$. So the treatment - group mean $\bar{x}_{2}=\frac{46}{6}=\frac{23}{3}$.
Step3: Calculate the difference in means
The difference in means $d=\bar{x}{2}-\bar{x}{1}=\frac{23}{3}-\frac{16}{3}=\frac{23 - 16}{3}=\frac{7}{3}\approx2.33$.
Answer:
2.33