select the correct answer. becky is an experienced swimmer. the table contains data on her times in the 100…
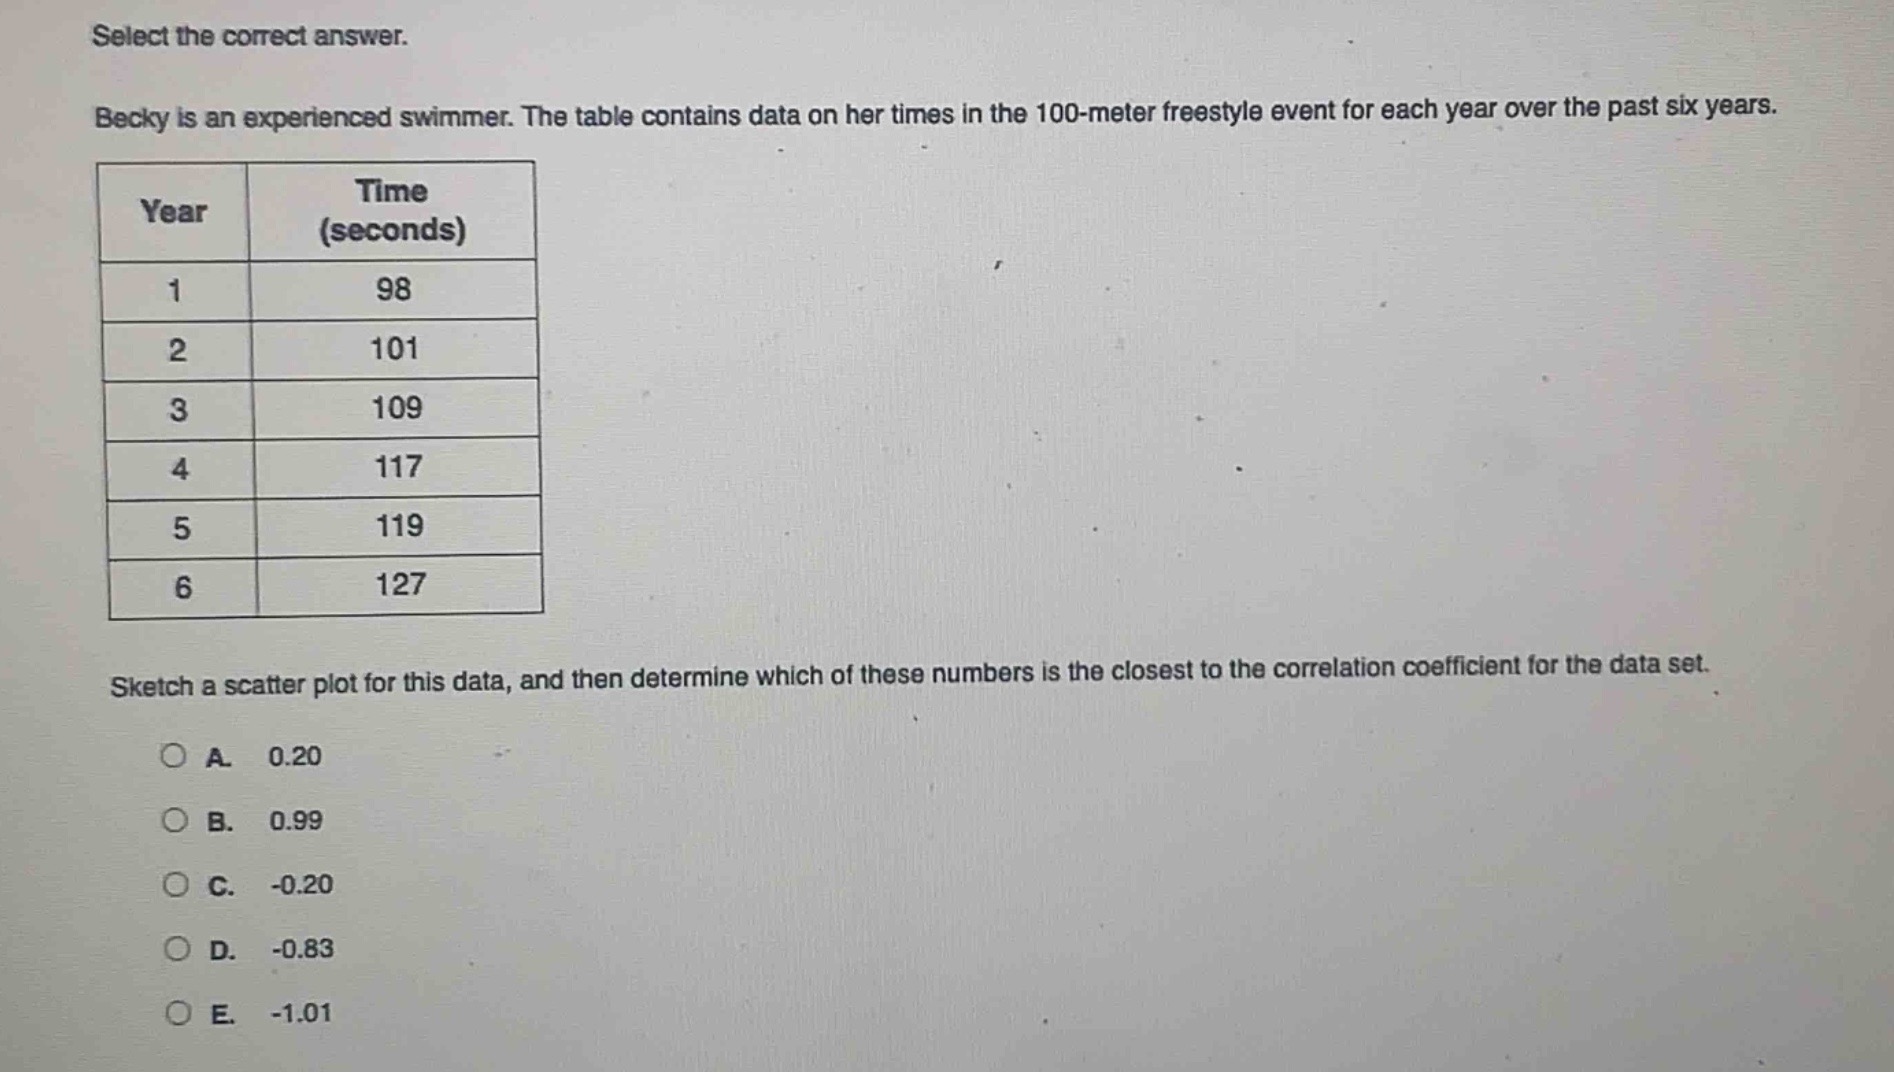
select the correct answer. becky is an experienced swimmer. the table contains data on her times in the 100 - meter freestyle event for each year over the past six years.\n| year | time (seconds) |\n| ---- | ---- |\n| 1 | 98 |\n| 2 | 101 |\n| 3 | 109 |\n| 4 | 117 |\n| 5 | 119 |\n| 6 | 127 |\nsketch a scatter plot for this data, and then determine which of these numbers is the closest to the correlation coefficient for the data set.\na. 0.20\nb. 0.99\nc. -0.20\nd. -0.83\ne. -1.01
Answer
Explanation:
Step1: Observe data trend
As the year increases, the time also increases. So, there is a positive - linear relationship.
Step2: Recall correlation coefficient range
The correlation coefficient $r$ ranges from - 1 to 1. A positive linear relationship has $r>0$.
Step3: Analyze strength of relationship
The data points seem to follow a fairly strong linear pattern. A strong positive linear relationship has a correlation coefficient close to 1.
Answer:
B. 0.99