select the correct answer.\nthe box - and - whisker plots below show the test scores for mr. scotts three…
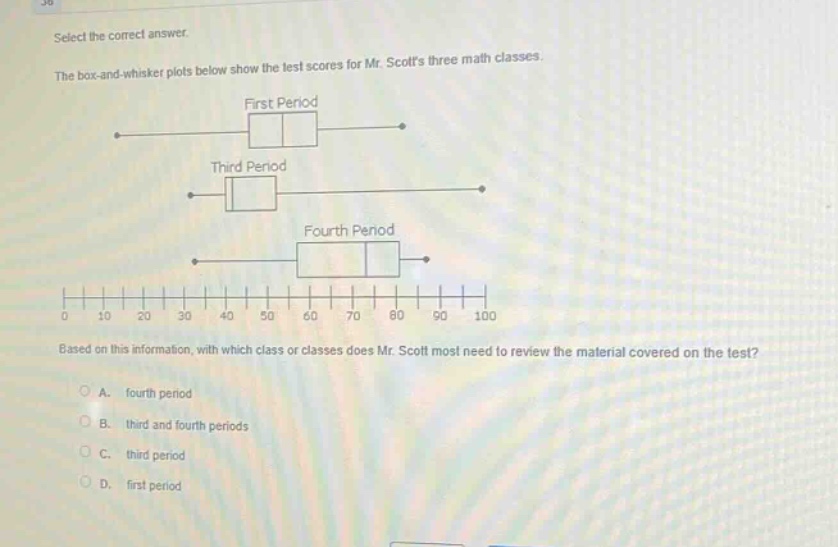
select the correct answer.\nthe box - and - whisker plots below show the test scores for mr. scotts three math classes.\nfirst period\nthird period\nfourth period\n0 10 20 30 40 50 60 70 80 90 100\nbased on this information, with which class or classes does mr. scott most need to review the material covered on the test?\na. fourth period\nb. third and fourth periods\nc. third period\nd. first period
Answer
Explanation:
Step1: Analyze box - and - whisker plots
Box - and - whisker plots show the distribution of data. Lower values indicate poorer performance on average. The third - period class has a lower median and lower overall range of scores compared to the first and fourth periods.
Step2: Determine the class for review
Since the third - period class has the lowest scores overall (lower median and lower range), Mr. Scott most needs to review the material with the third - period class.
Answer:
C. third period