select the correct answer.\na car salesman sells cars with prices ranging from $5,000 to $45,000. the…
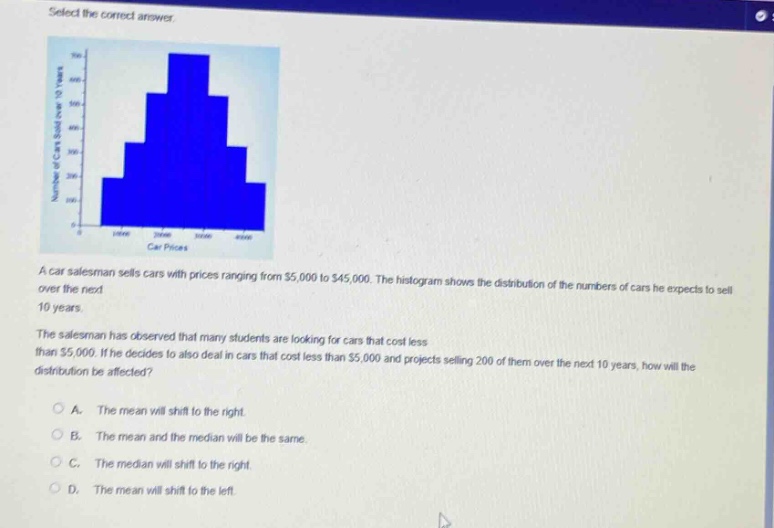
select the correct answer.\na car salesman sells cars with prices ranging from $5,000 to $45,000. the histogram shows the distribution of the numbers of cars he expects to sell over the next 10 years.\nthe salesman has observed that many students are looking for cars that cost less than $5,000. if he decides to also deal in cars that cost less than $5,000 and projects selling 200 of them over the next 10 years, how will the distribution be affected?\na. the mean will shift to the right.\nb. the mean and the median will be the same.\nc. the median will shift to the right.\nd. the mean will shift to the left.
Answer
Answer:
D. The mean will shift to the left.
Explanation:
Step1: Understand mean concept
Mean is sum of values/number of values.
Step2: Analyze new data
New cars are lower - priced. Adding 200 low - priced cars increases total number of cars.
Step3: Consider impact on mean
Sum of prices will increase by low - value amounts. So, mean (average price) will decrease and shift to the left.