select the correct answer. which conclusion can be derived from this scatter plot? a. the average…
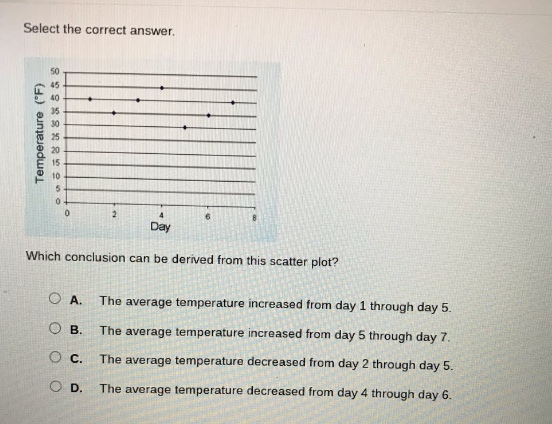
select the correct answer. which conclusion can be derived from this scatter plot? a. the average temperature increased from day 1 through day 5. b. the average temperature increased from day 5 through day 7. c. the average temperature decreased from day 2 through day 5. d. the average temperature decreased from day 4 through day 6.
Answer
Explanation:
Step1: Observe temperature values
For day - 1: around 35°F; day - 2: around 40°F; day - 3: around 45°F; day - 4: around 25°F; day - 5: around 35°F; day - 6: around 35°F; day - 7: around 40°F.
Step2: Analyze option A
From day 1 (35°F) to day 5 (35°F), the temperature first increased (day 1 - 3) and then decreased (day 3 - 4), and then increased a bit to 35°F on day 5. The average is not clearly increasing.
Step3: Analyze option B
From day 5 (35°F) to day 7 (40°F), the temperature increased. The average temperature increased from day 5 through day 7.
Step4: Analyze option C
From day 2 (40°F) to day 5 (35°F), the temperature decreased from day 3 - 4 but overall from day 2 - 5 it first increased then decreased and the average is not clearly decreasing.
Step5: Analyze option D
From day 4 (25°F) to day 6 (35°F), the temperature increased, so the average temperature did not decrease.
Answer:
B. The average temperature increased from day 5 through day 7.