select the correct answer. consider this scatter plot. which line best fits the data? a. line a b. line b c…
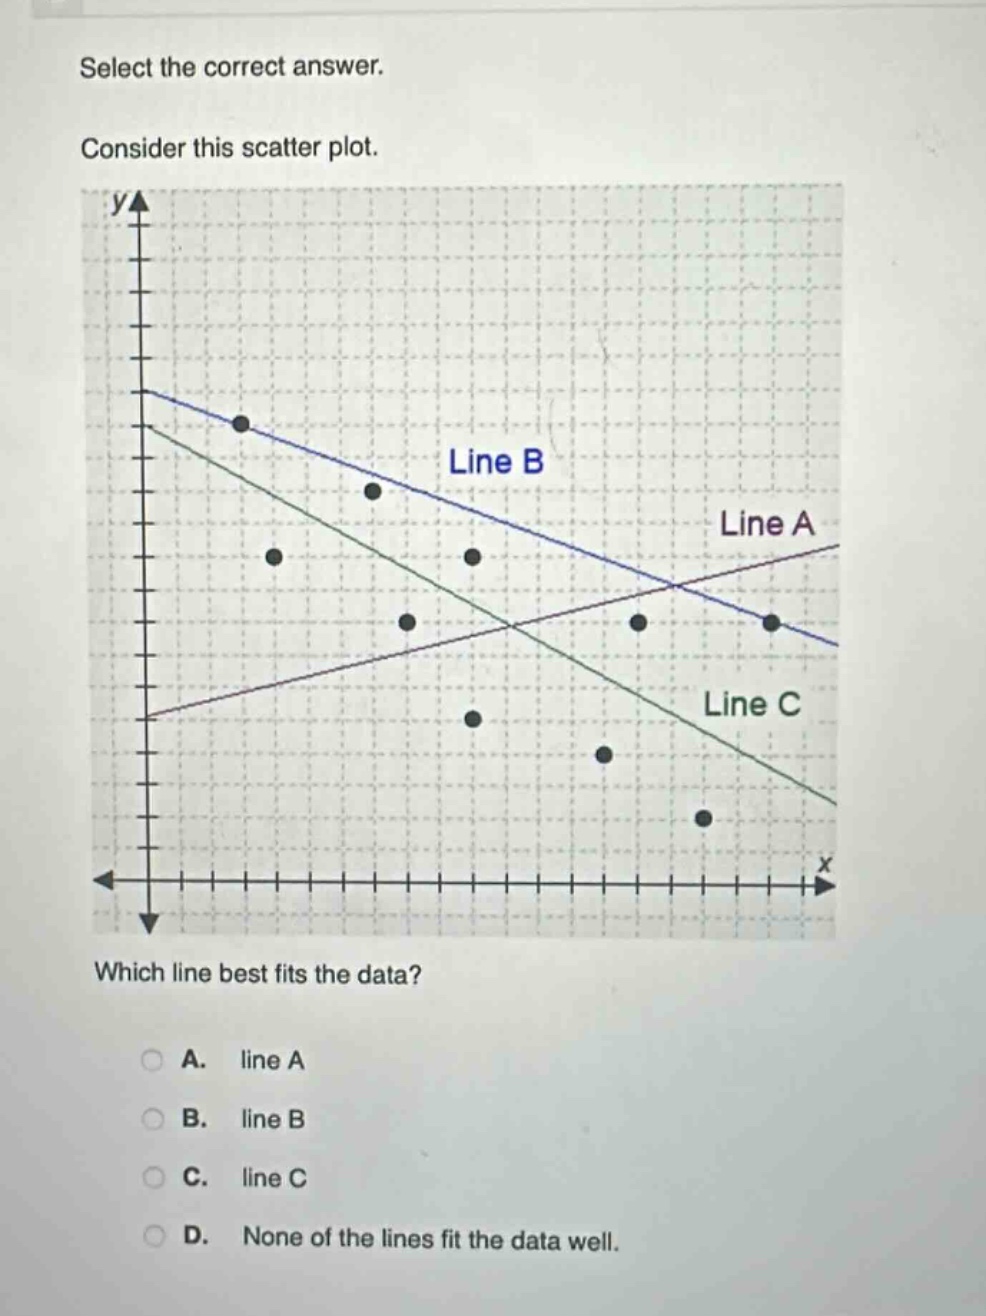
select the correct answer. consider this scatter plot. which line best fits the data? a. line a b. line b c. line c d. none of the lines fit the data well.
Answer
Explanation:
Step1: Observe the scatter - plot
A good line of best - fit should have the data points evenly distributed around it.
Step2: Analyze each line
Line A has most of the points above it. Line C has most of the points below it. Line B has points more evenly distributed above and below it.
Answer:
B. line B