select the correct answer.\nthe developer of a new plant fertilizer gathered data about the quantity of…
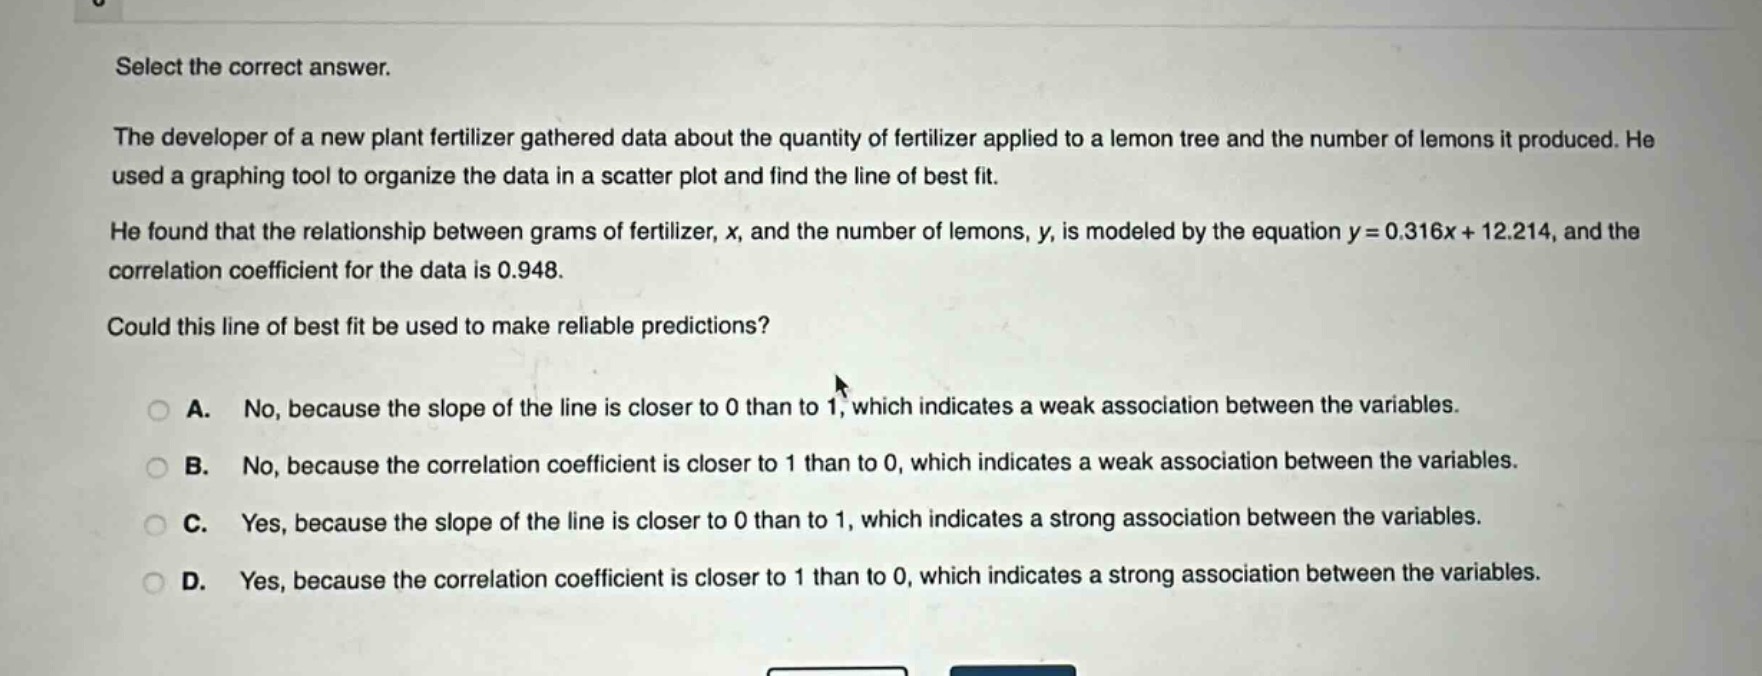
select the correct answer.\nthe developer of a new plant fertilizer gathered data about the quantity of fertilizer applied to a lemon tree and the number of lemons it produced. he used a graphing tool to organize the data in a scatter plot and find the line of best fit.\nhe found that the relationship between grams of fertilizer, x, and the number of lemons, y, is modeled by the equation y = 0.316x + 12.214, and the correlation coefficient for the data is 0.948.\ncould this line of best fit be used to make reliable predictions?\n\na. no, because the slope of the line is closer to 0 than to 1, which indicates a weak association between the variables.\nb. no, because the correlation coefficient is closer to 1 than to 0, which indicates a weak association between the variables.\nc. yes, because the slope of the line is closer to 0 than to 1, which indicates a strong association between the variables.\nd. yes, because the correlation coefficient is closer to 1 than to 0, which indicates a strong association between the variables.
Answer
Explanation:
Step1: Understand correlation coefficient
The correlation coefficient (r) measures the strength and direction of a linear relationship. Values range from - 1 to 1. A value close to 1 or - 1 indicates a strong linear relationship, while a value close to 0 indicates a weak linear relationship.
Step2: Analyze given correlation coefficient
Here, the correlation coefficient (r = 0.948), which is close to 1. This means there is a strong positive - linear relationship between the quantity of fertilizer ((x)) and the number of lemons ((y)).
Step3: Determine reliability of prediction
Since there is a strong linear relationship (as indicated by the correlation coefficient close to 1), the line of best fit (y = 0.316x+12.214) can be used to make reliable predictions.
Answer:
D. Yes, because the correlation coefficient is closer to 1 than to 0, which indicates a strong association between the variables.