select the correct answer from each drop - down menu. the box plot shows the typing speed (in words per…
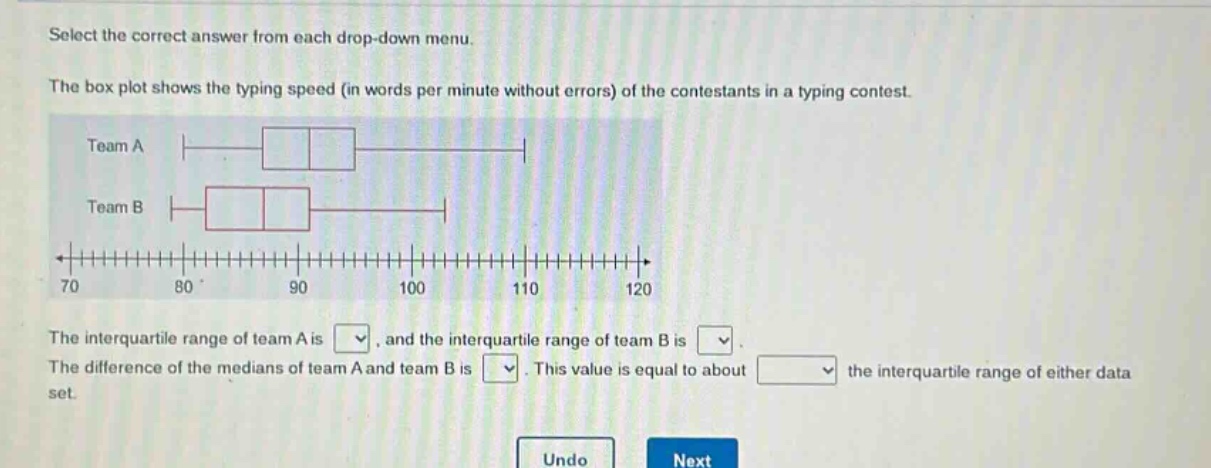
select the correct answer from each drop - down menu. the box plot shows the typing speed (in words per minute without errors) of the contestants in a typing contest. team a team b 70 80 90 100 110 120 the interquartile range of team a is, and the interquartile range of team b is. the difference of the medians of team a and team b is. this value is equal to about the interquartile range of either data set.
Answer
Explanation:
Step1: Recall IQR formula
The inter - quartile range (IQR) is $Q_3 - Q_1$, where $Q_1$ is the first quartile and $Q_3$ is the third quartile. For team A: From the box - plot, $Q_1$ of team A is 85 and $Q_3$ of team A is 100. So, $IQR_A=100 - 85=15$.
Step2: Calculate IQR for team B
For team B: From the box - plot, $Q_1$ of team B is 80 and $Q_3$ of team B is 95. So, $IQR_B=95 - 80 = 15$.
Step3: Find medians
The median of team A ($M_A$) is 90 and the median of team B ($M_B$) is 85. The difference of the medians is $|M_A - M_B|=|90 - 85| = 5$.
Step4: Compare difference of medians to IQR
We know that $IQR_A = IQR_B=15$. And $\frac{5}{15}=\frac{1}{3}$.
Answer:
The interquartile range of team A is 15, and the interquartile range of team B is 15. The difference of the medians of team A and team B is 5. This value is equal to about $\frac{1}{3}$ the interquartile range of either data set.