select the correct answer from each drop - down menu. the following histogram displays the test score…
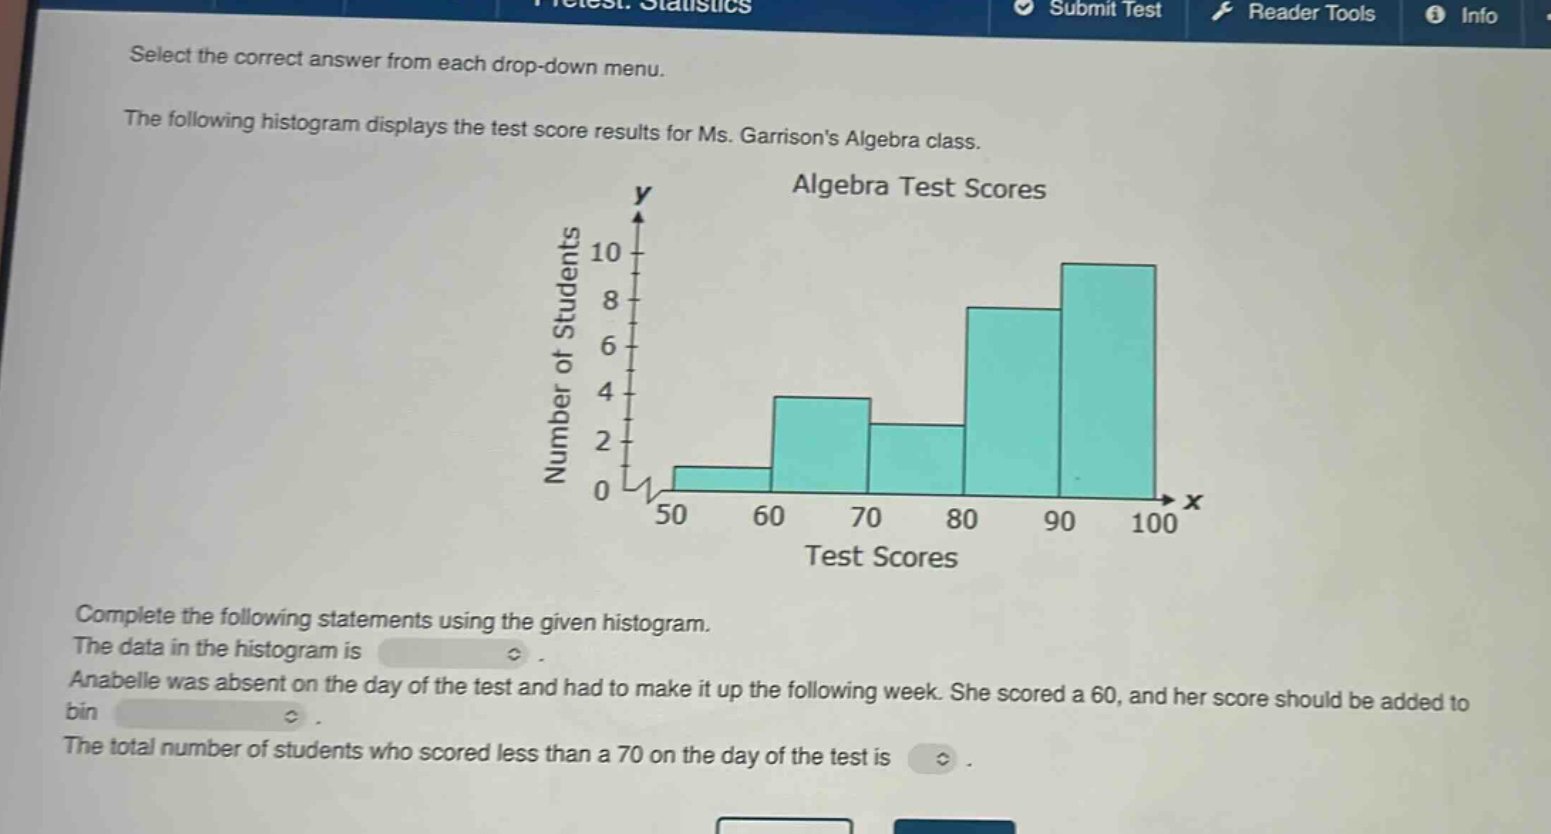
select the correct answer from each drop - down menu. the following histogram displays the test score results for ms. garrisons algebra class. algebra test scores complete the following statements using the given histogram. the data in the histogram is. anabelle was absent on the day of the test and had to make it up the following week. she scored a 60, and her score should be added to bin. the total number of students who scored less than a 70 on the day of the test is.
Answer
Explanation:
Step1: Identify data type
The data in the histogram represents test - scores of students. Since test - scores are numerical values that can be counted and measured, the data is quantitative.
Step2: Determine bin for Anabelle's score
Anabelle scored 60. Looking at the histogram, the score 60 falls into the bin 60 - 70.
Step3: Calculate number of students with score less than 70
The number of students in the 50 - 60 bin is 1 and in the 60 - 70 bin is 4. So the total number of students who scored less than 70 is (1 + 4=5).
Answer:
The data in the histogram is quantitative. Anabelle's score should be added to bin 60 - 70. The total number of students who scored less than a 70 on the day of the test is 5.