select the correct answer from each drop - down menu. the given dot plot represents the average daily…
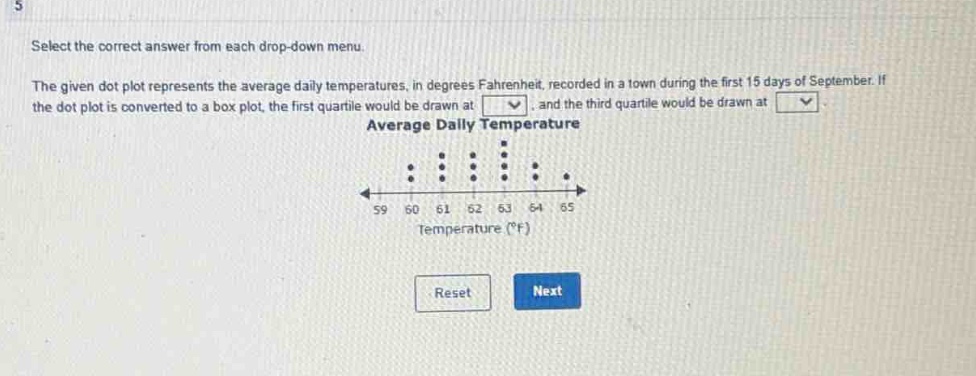
select the correct answer from each drop - down menu. the given dot plot represents the average daily temperatures, in degrees fahrenheit, recorded in a town during the first 15 days of september. if the dot plot is converted to a box plot, the first quartile would be drawn at, and the third quartile would be drawn at. average daily temperature temperature (°f)
Answer
Explanation:
Step1: Arrange data in ascending - order
The data points from the dot - plot are: 59, 60, 60, 61, 61, 61, 62, 62, 62, 62, 63, 63, 64, 64, 65. There are (n = 15) data points.
Step2: Calculate the position of the first quartile ((Q_1))
The formula for the position of (Q_1) is (i=\frac{1}{4}(n + 1)). Substituting (n = 15), we get (i=\frac{1}{4}(15 + 1)=\frac{16}{4}=4). The 4th value in the ordered data set is 61.
Step3: Calculate the position of the third quartile ((Q_3))
The formula for the position of (Q_3) is (i=\frac{3}{4}(n + 1)). Substituting (n = 15), we get (i=\frac{3}{4}(15 + 1)=\frac{3\times16}{4}=12). The 12th value in the ordered data set is 63.
Answer:
First quartile: 61, Third quartile: 63