select the correct answer from each drop - down menu. ten students compared the amount (in dollars) they…
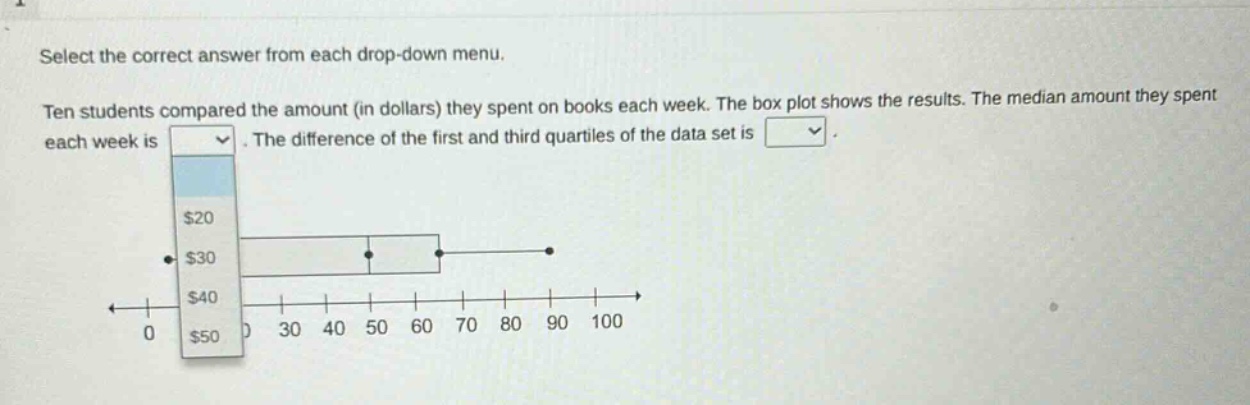
select the correct answer from each drop - down menu. ten students compared the amount (in dollars) they spent on books each week. the box plot shows the results. the median amount they spent each week is. the difference of the first and third quartiles of the data set is.
Answer
Explanation:
Step1: Identify median from box - plot
For a box - plot with (n = 10) (an even number of data points), the median is the average of the 5th and 6th ordered data points. In a box - plot, the line inside the box represents the median. Here, the median is at (50).
Step2: Identify first and third quartiles
The left - hand side of the box represents the first quartile ((Q_1)) and the right - hand side of the box represents the third quartile ((Q_3)). From the box - plot, (Q_1=30) and (Q_3 = 70).
Step3: Calculate the inter - quartile range
The difference between the third and first quartiles ((IQR=Q_3 - Q_1)). So, (IQR=70 - 30=40).
Answer:
The median amount they spent each week is ($50). The difference of the first and third quartiles of the data set is ($40).