select the correct answer from each drop - down menu. ten students compared the amount (in dollars) they…
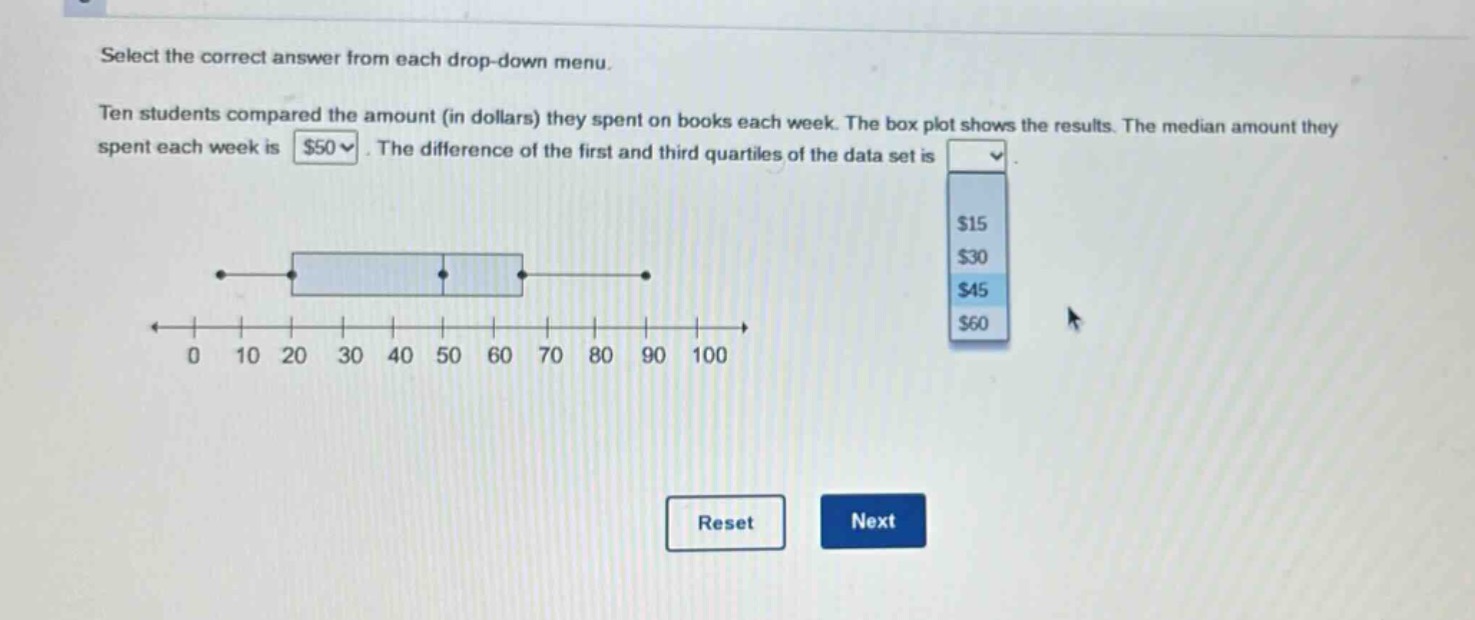
select the correct answer from each drop - down menu. ten students compared the amount (in dollars) they spent on books each week. the box plot shows the results. the median amount they spent each week is $50. the difference of the first and third quartiles of the data set is
Answer
Answer:
The difference of the first and third quartiles of the data - set is $30$.
Explanation:
Step1: Identify first quartile ($Q_1$)
From the box - plot, $Q_1 = 30$.
Step2: Identify third quartile ($Q_3$)
From the box - plot, $Q_3 = 60$.
Step3: Calculate the inter - quartile range (IQR)
$IQR=Q_3 - Q_1=60 - 30 = 30$.