select the correct answer. when evaluating a survey, jody saw that 54% of the respondents think that the…
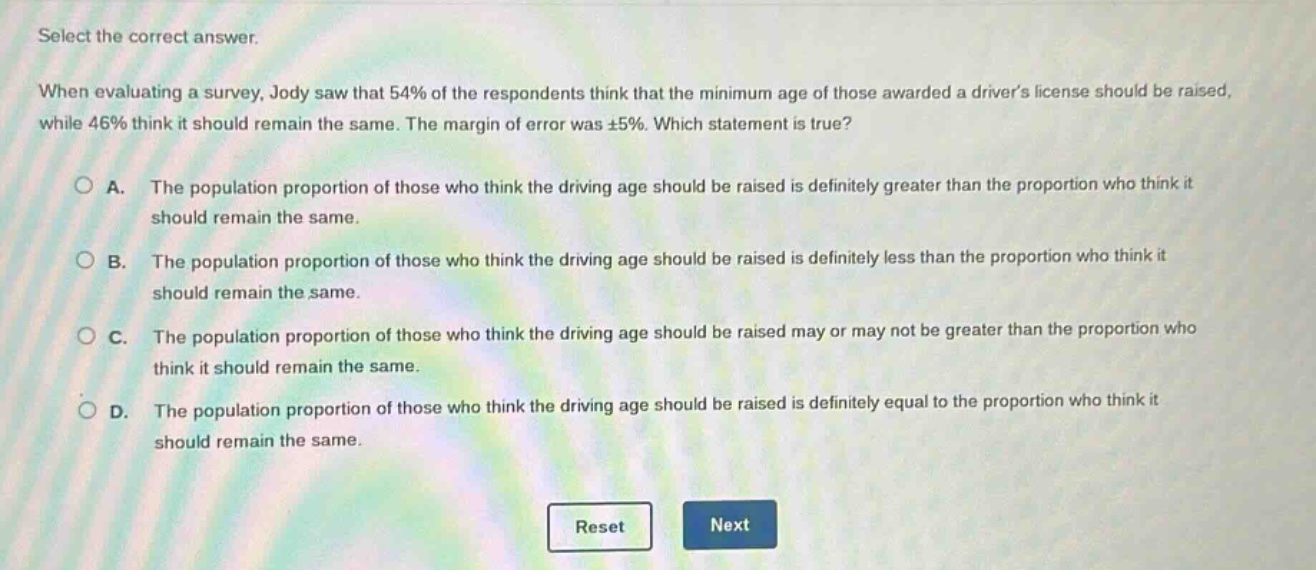
select the correct answer. when evaluating a survey, jody saw that 54% of the respondents think that the minimum age of those awarded a drivers license should be raised, while 46% think it should remain the same. the margin of error was ±5%. which statement is true? a. the population proportion of those who think the driving age should be raised is definitely greater than the proportion who think it should remain the same. b. the population proportion of those who think the driving age should be raised is definitely less than the proportion who think it should remain the same. c. the population proportion of those who think the driving age should be raised may or may not be greater than the proportion who think it should remain the same. d. the population proportion of those who think the driving age should be raised is definitely equal to the proportion who think it should remain the same.
Answer
Explanation:
Step1: Calculate the confidence intervals
For those who think the driving - age should be raised: The sample proportion is $p_1 = 0.54$, and the margin of error $E=0.05$. The confidence interval is $0.54 - 0.05\leq p_{population1}\leq0.54 + 0.05$, i.e., $0.49\leq p_{population1}\leq0.59$. For those who think the driving - age should remain the same: The sample proportion is $p_2 = 0.46$, and the margin of error $E = 0.05$. The confidence interval is $0.46-0.05\leq p_{population2}\leq0.46 + 0.05$, i.e., $0.41\leq p_{population2}\leq0.51$.
Step2: Analyze the overlap of intervals
Since the confidence intervals $[0.49,0.59]$ and $[0.41,0.51]$ overlap, we cannot be sure whether the population proportion of those who think the driving age should be raised is greater than, less than, or equal to the population proportion of those who think it should remain the same.
Answer:
C. The population proportion of those who think the driving age should be raised may or may not be greater than the proportion who think it should remain the same.