select the correct answer. fiona has to plot a histogram of the given data. 82, 83, 89, 67, 65, 88, 66, 69…
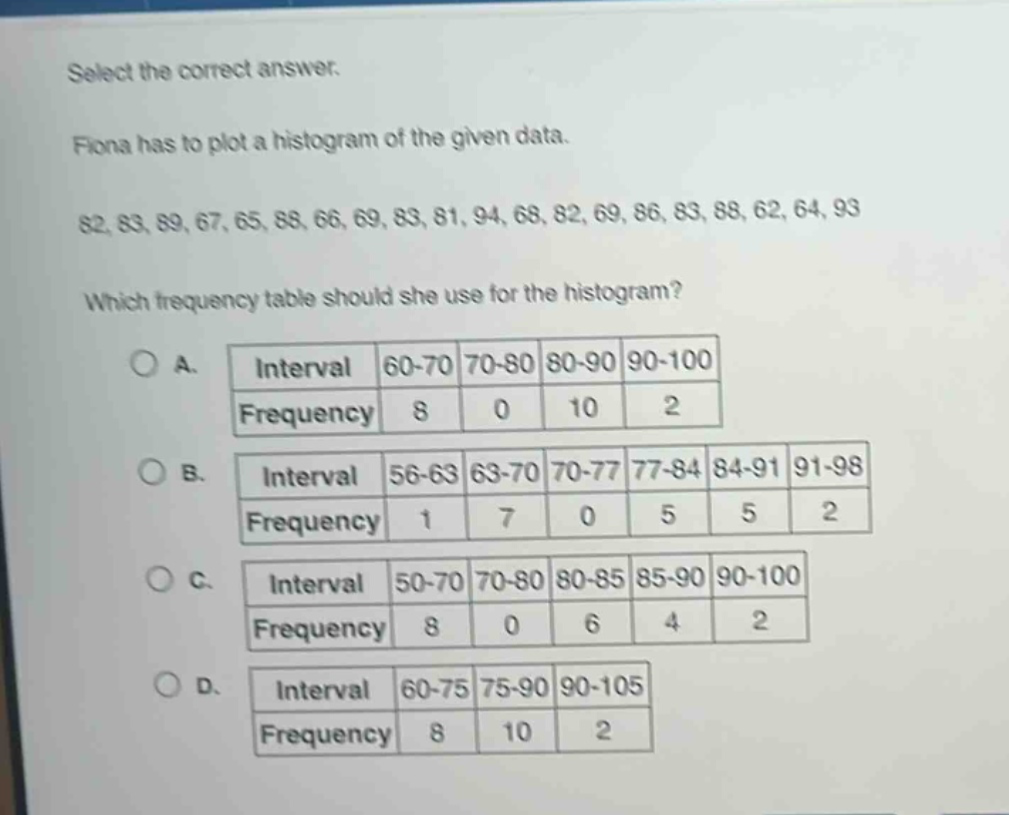
select the correct answer. fiona has to plot a histogram of the given data. 82, 83, 89, 67, 65, 88, 66, 69, 83, 81, 94, 68, 82, 69, 86, 83, 88, 62, 64, 93 which frequency table should she use for the histogram? a. interval 60 - 70 70 - 80 80 - 90 90 - 100 frequency 8 0 10 2 b. interval 56 - 63 63 - 70 70 - 77 77 - 84 84 - 91 91 - 98 frequency 1 7 0 5 5 2 c. interval 50 - 70 70 - 80 80 - 85 85 - 90 90 - 100 frequency 8 0 6 4 2 d. interval 60 - 75 75 - 90 90 - 105 frequency 8 10 2
Answer
Explanation:
Step1: Count data in intervals for option A
For the interval 60 - 70: The numbers 67, 65, 66, 69, 68, 69, 62, 64 are in this range, so frequency is 8. For 70 - 80: No numbers in this range, frequency is 0. For 80 - 90: 82, 83, 89, 88, 83, 81, 82, 86, 83, 88 are in this range, frequency is 10. For 90 - 100: 94, 93 are in this range, frequency is 2.
Step2: Check other options
Option B: The intervals are not as standard as option A and the frequency - counting for these non - standard intervals does not match the data distribution as well as option A. Option C: The intervals are not as intuitive as option A and the frequency for sub - intervals within 80 - 90 is split in a non - standard way compared to option A. Option D: The intervals 60 - 75 and 75 - 90 are too wide and do not represent the data as clearly as option A.
Answer:
A. Interval 60-70, Frequency 8; Interval 70-80, Frequency 0; Interval 80-90, Frequency 10; Interval 90-100, Frequency 2