select the correct answer.\nthe graph gives data on the percentage of students who worked less than 15 hours…
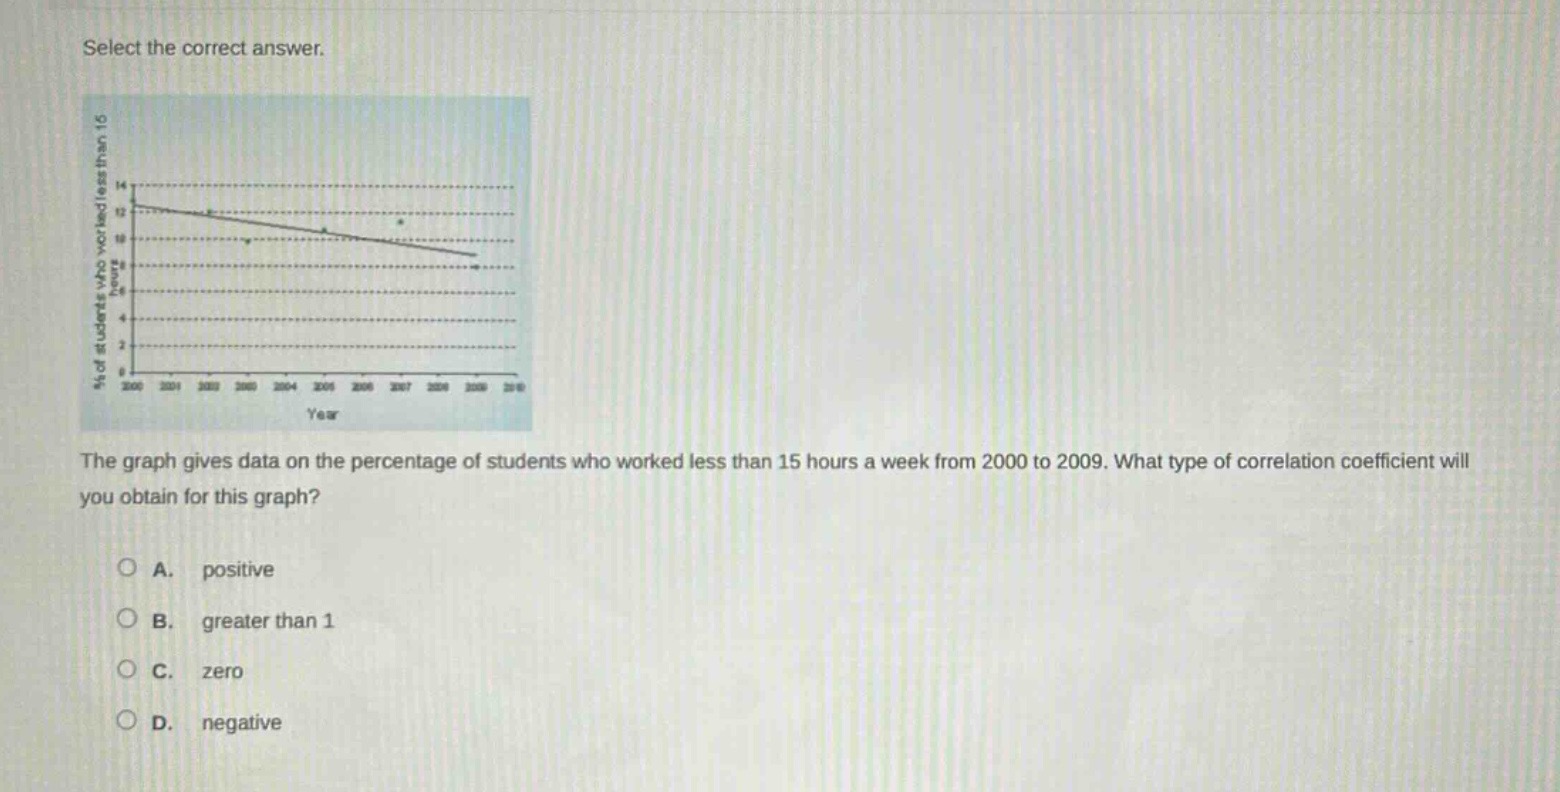
select the correct answer.\nthe graph gives data on the percentage of students who worked less than 15 hours a week from 2000 to 2009. what type of correlation coefficient will you obtain for this graph?\na. positive\nb. greater than 1\nc. zero\nd. negative
Answer
Explanation:
Step1: Observe the graph trend
As the year increases from 2000 - 2009, the percentage of students who worked less than 15 hours a week decreases.
Step2: Recall correlation coefficient concept
A negative correlation exists when one variable increases and the other decreases.
Answer:
D. negative