select the correct answer. what is the relationship between the two variables represented in the table…
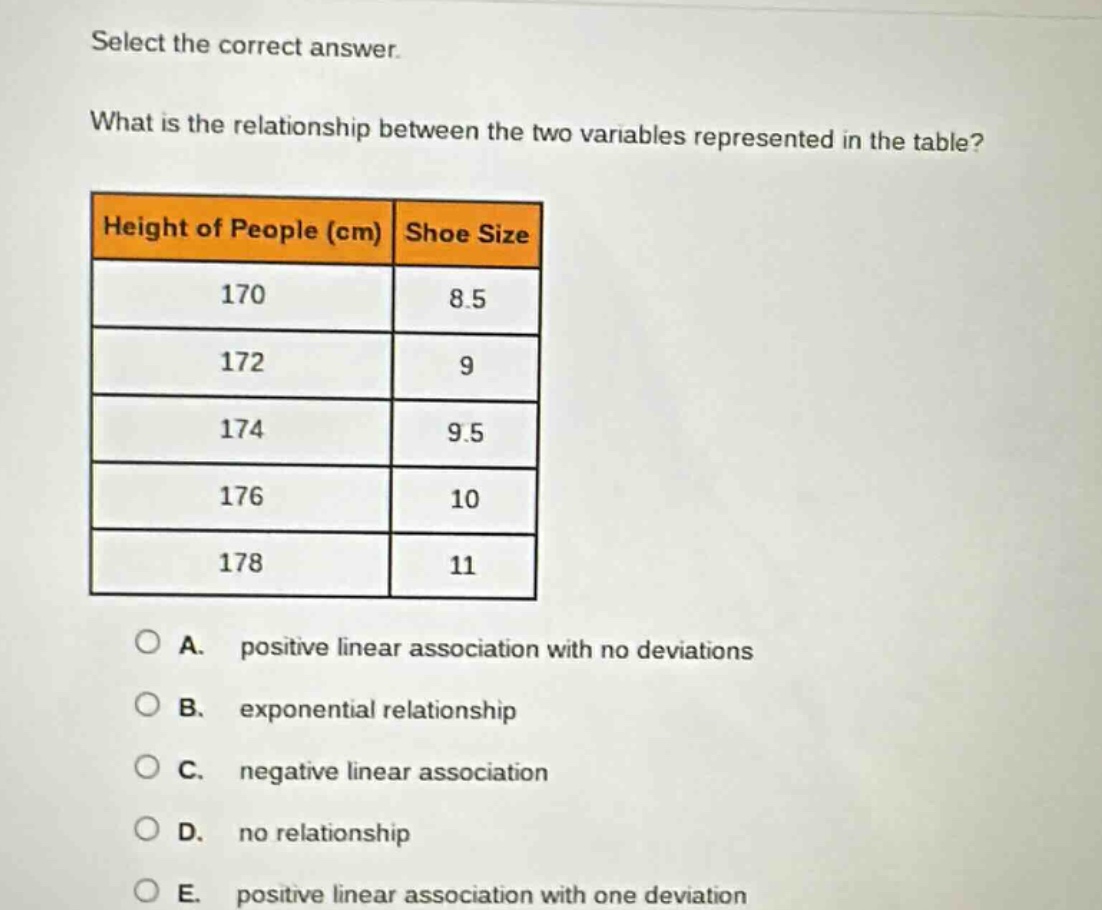
select the correct answer. what is the relationship between the two variables represented in the table? height of people (cm) shoe size 170 8.5 172 9 174 9.5 176 10 178 11 a. positive linear association with no deviations b. exponential relationship c. negative linear association d. no relationship e. positive linear association with one deviation
Answer
Explanation:
Step1: Observe variable changes
As height increases from 170 cm to 178 cm (increments of 2 cm), shoe - size increases from 8.5 to 11 (increments of 0.5 or 1).
Step2: Determine relationship type
The increase in one variable (height) leads to a corresponding increase in the other variable (shoe - size) in a relatively constant rate. This indicates a positive linear relationship. Also, there are no data points that deviate from this pattern.
Answer:
A. positive linear association with no deviations