select the correct answer. which statement about a histogram is true? a. histograms can plot both positive…
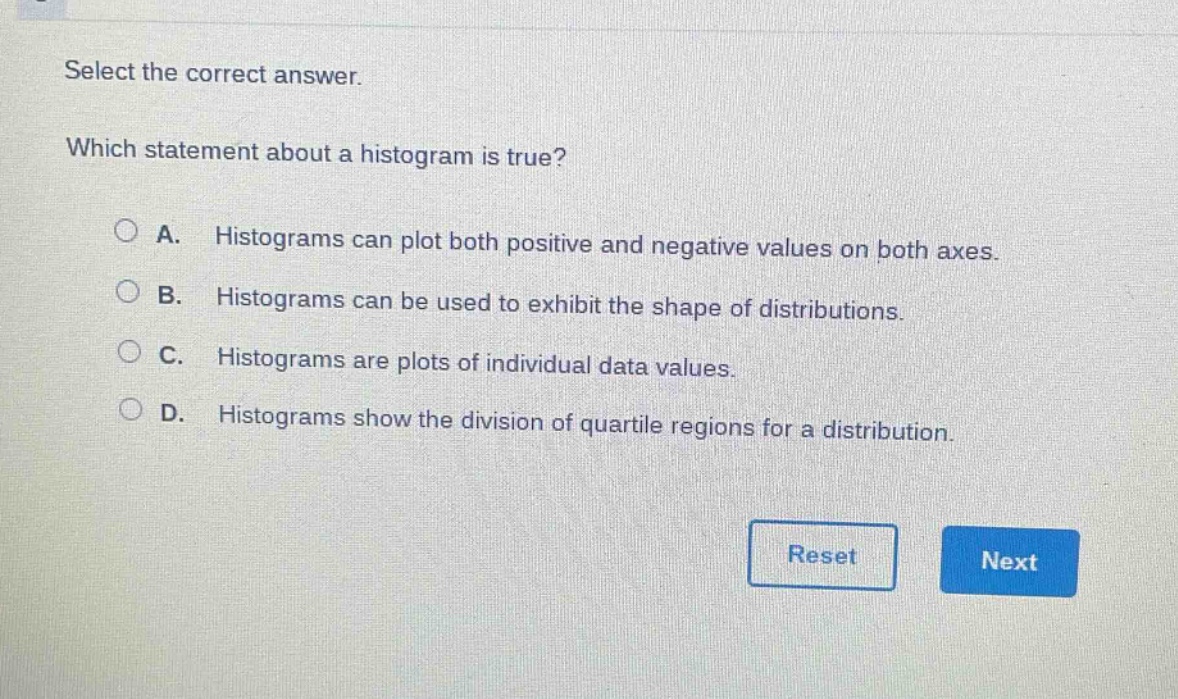
select the correct answer. which statement about a histogram is true? a. histograms can plot both positive and negative values on both axes. b. histograms can be used to exhibit the shape of distributions. c. histograms are plots of individual data values. d. histograms show the division of quartile regions for a distribution.
Answer
Brief Explanations:
- Option A: Histograms usually have non - negative frequencies on the y - axis and represent ranges of values on the x - axis, not both positive and negative on both axes.
- Option B: Histograms group data into intervals and display the frequency of data in each interval, which helps in visualizing the shape of the data distribution (e.g., symmetric, skewed).
- Option C: Histograms show frequencies of data within intervals, not individual data values.
- Option D: Box - and - whisker plots are used to show quartile regions, not histograms.
Answer:
B. Histograms can be used to exhibit the shape of distributions.