select the correct answer.\nwhich statement is true about a dot plot?\na. a dot plot shows the median of a…
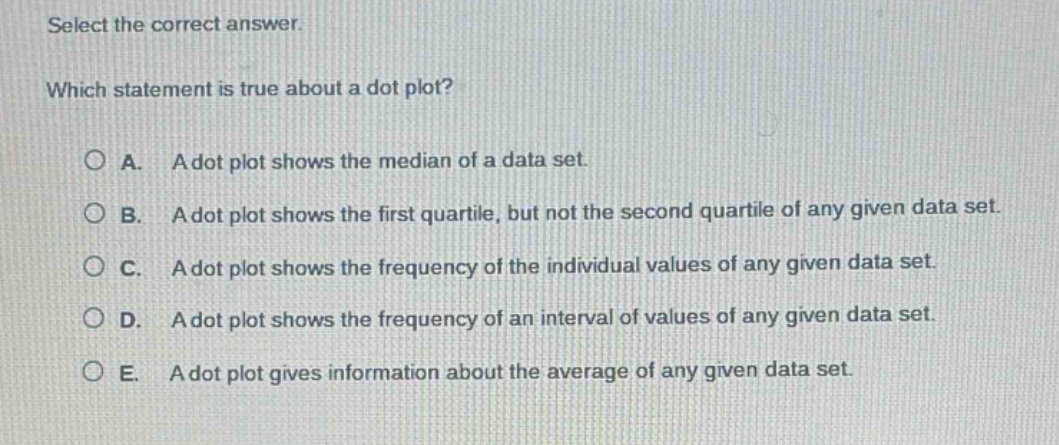
select the correct answer.\nwhich statement is true about a dot plot?\na. a dot plot shows the median of a data set.\nb. a dot plot shows the first quartile, but not the second quartile of any given data set.\nc. a dot plot shows the frequency of the individual values of any given data set.\nd. a dot plot shows the frequency of an interval of values of any given data set.\ne. a dot plot gives information about the average of any given data set.
Answer
Answer:
C. A dot plot shows the frequency of the individual values of any given data set.
Brief Explanations:
A dot - plot represents each data point as a dot above its corresponding value on a number line. The number of dots above a value indicates its frequency in the data set. It doesn't directly show median, quartiles or average. It shows individual - value frequencies.