select the correct plot. which data set best approximates a normal distribution?
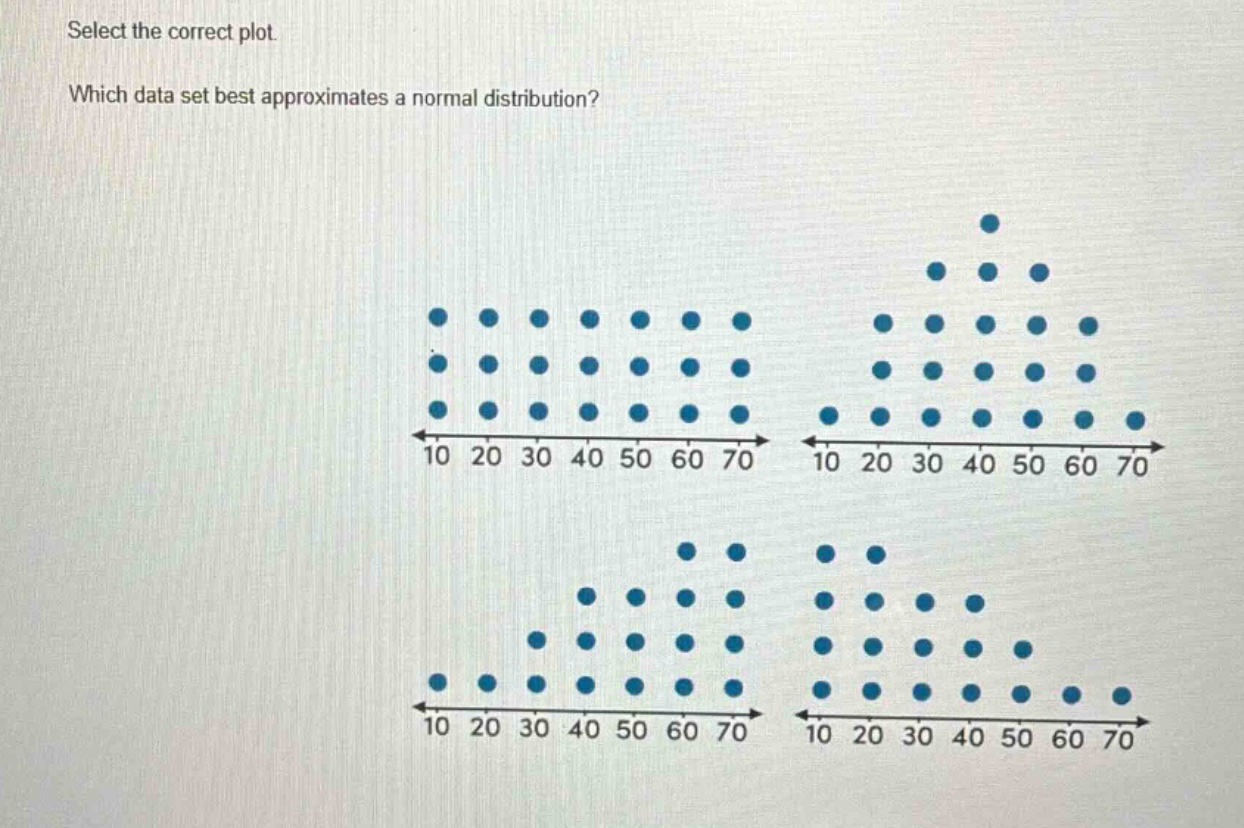
select the correct plot. which data set best approximates a normal distribution?
Answer
Answer:
The plot in the upper - right corner.
Explanation:
Step1: Recall normal distribution shape
A normal distribution has a bell - shaped curve, symmetric about the mean.
Step2: Analyze plots
The upper - right plot is symmetric about the middle value (around 40), with fewer data points as we move away from the center, which is characteristic of a normal distribution. The upper - left plot is uniform. The lower - left plot is right - skewed. The lower - right plot is left - skewed.