select the correct scatter plots. identify the scatter plots that show a strong negative association.
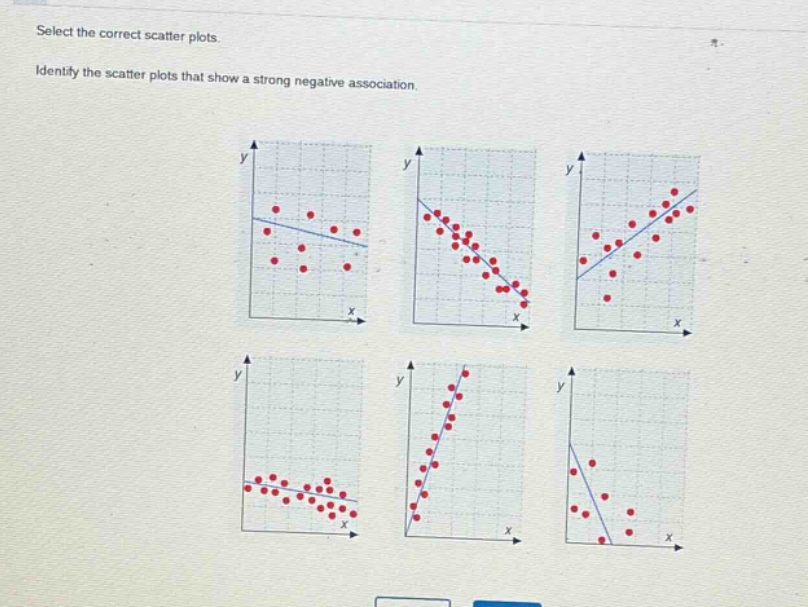
select the correct scatter plots. identify the scatter plots that show a strong negative association.
Answer
Explanation:
Step1: Understand negative - association
In a negative - association, as the value of the x - variable increases, the value of the y - variable decreases.
Step2: Identify strong association
A strong association has points that closely follow a line.
Step3: Analyze scatter - plots
The scatter - plots with points closely following a downward - sloping line show a strong negative association.
Answer:
The scatter - plot in the top - middle and the bottom - right show a strong negative association.