select the correct section on the seating chart.\nleanne and her family plan to attend a symphony at an…
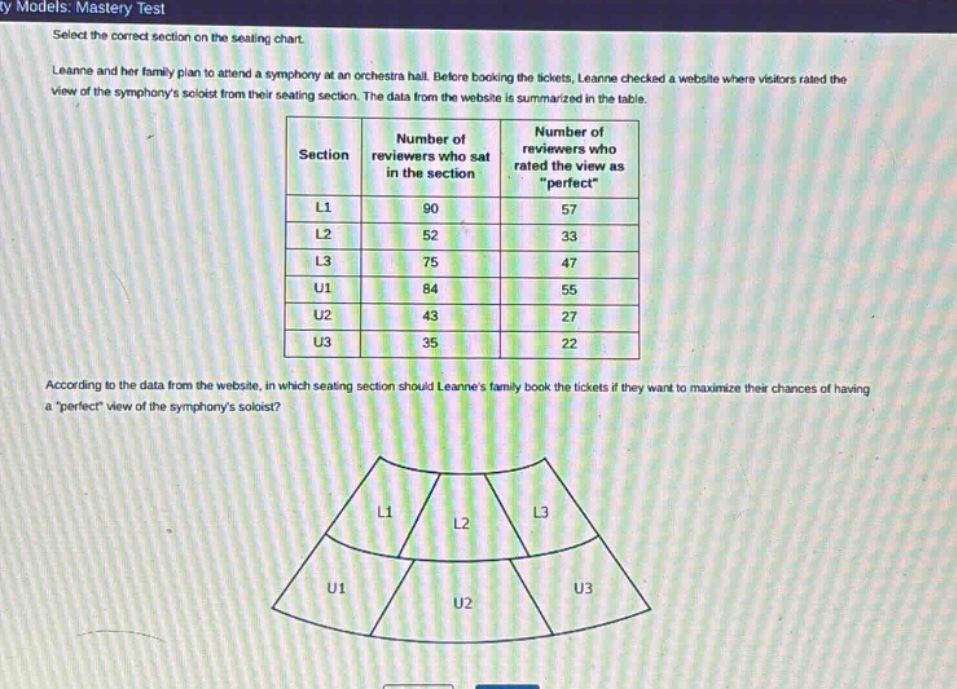
select the correct section on the seating chart.\nleanne and her family plan to attend a symphony at an orchestra hall. before booking the tickets, leanne checked a website where visitors rated the view of the symphonys soloist from their seating section. the data from the website is summarized in the table.\n\n| section | number of reviewers who sat in the section | number of reviewers who rated the view as \perfect\ |\n| ---- | ---- | ---- |\n| l1 | 90 | 57 |\n| l2 | 52 | 33 |\n| l3 | 75 | 47 |\n| u1 | 84 | 55 |\n| u2 | 43 | 27 |\n| u3 | 35 | 22 |\n\naccording to the data from the website, in which seating section should leannes family book the tickets if they want to maximize their chances of having a \perfect\ view of the symphonys soloist?
Answer
Explanation:
Step1: Calculate the proportion for L1
The proportion of "perfect" - rated views in L1 is $\frac{57}{90}\approx0.633$.
Step2: Calculate the proportion for L2
The proportion of "perfect" - rated views in L2 is $\frac{33}{52}\approx0.635$.
Step3: Calculate the proportion for L3
The proportion of "perfect" - rated views in L3 is $\frac{47}{75}\approx0.627$.
Step4: Calculate the proportion for U1
The proportion of "perfect" - rated views in U1 is $\frac{55}{84}\approx0.655$.
Step5: Calculate the proportion for U2
The proportion of "perfect" - rated views in U2 is $\frac{27}{43}\approx0.628$.
Step6: Calculate the proportion for U3
The proportion of "perfect" - rated views in U3 is $\frac{22}{35}\approx0.629$.
Step7: Compare the proportions
By comparing the proportions $0.627<0.628<0.629<0.633<0.635<0.655$.
Answer:
U1