select the outlier in the data set.\n602 558 560 567 575 607 563 510 629 617 5735 505 606 570\n509 574 599 517
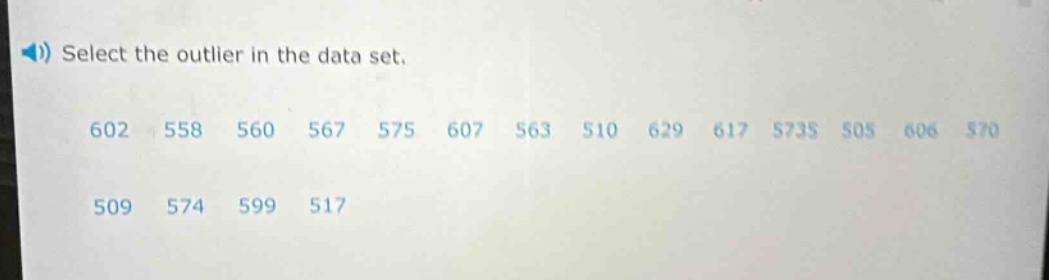
select the outlier in the data set.\n602 558 560 567 575 607 563 510 629 617 5735 505 606 570\n509 574 599 517
Answer
Explanation:
Step1: Arrange data in ascending order
505, 509, 510, 517, 558, 560, 563, 567, 570, 573, 574, 575, 599, 602, 606, 607, 617, 629
Step2: Calculate quartiles
First, find the median (Q2). Since there are 18 data - points, the median is the average of the 9th and 10th ordered values. Q2=$\frac{570 + 573}{2}=571.5$. The lower half of the data is 505, 509, 510, 517, 558, 560, 563, 567, 570. The median of the lower half (Q1) is the 5th value, so Q1 = 558. The upper half of the data is 573, 574, 575, 599, 602, 606, 607, 617, 629. The median of the upper half (Q3) is the 5th value of the upper - half, so Q3 = 602.
Step3: Calculate the inter - quartile range (IQR)
IQR = Q3 - Q1 = 602 - 558 = 44.
Step4: Determine the outlier boundaries
Lower boundary = Q1-1.5IQR = 558 - 1.544 = 558 - 66 = 492. Upper boundary = Q3 + 1.5IQR = 602+1.544 = 602 + 66 = 668.
Step5: Identify the outlier
All the data points 505, 509, 510, 517, 558, 560, 563, 567, 570, 573, 574, 575, 599, 602, 606, 607, 617, 629 are within the range [492, 668]. There is no outlier in this data - set.
Answer:
There is no outlier.