for each set of data, (a) calculate the standard deviation, (b) state the interval that, if normally…
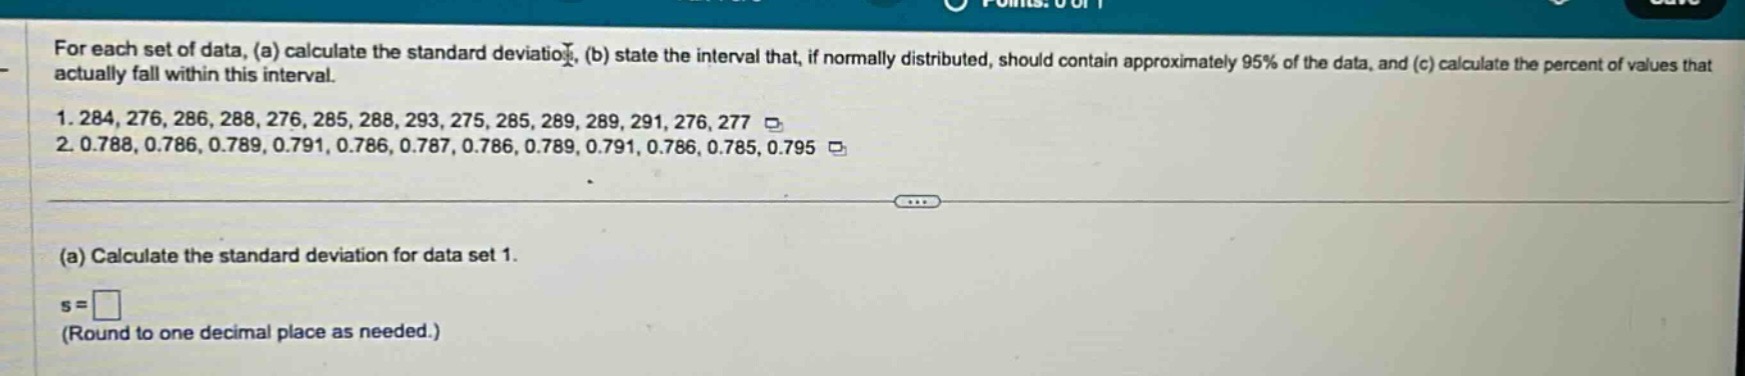
for each set of data, (a) calculate the standard deviation, (b) state the interval that, if normally distributed, should contain approximately 95% of the data, and (c) calculate the percent of values that actually fall within this interval.\n1. 284, 276, 286, 288, 276, 285, 288, 293, 275, 285, 289, 289, 291, 276, 277\n2. 0.788, 0.786, 0.789, 0.791, 0.786, 0.787, 0.786, 0.789, 0.791, 0.786, 0.785, 0.795\n(a) calculate the standard deviation for data set 1.\ns = \n(round to one decimal place as needed.)
Answer
Explanation:
Step1: Calculate the mean
First, sum the data values in set 1: $284 + 276+286+288+276+285+288+293+275+285+289+289+291+276+277=4238$. There are $n = 15$ data - points. The mean $\bar{x}=\frac{4238}{15}\approx282.53$.
Step2: Calculate the squared differences
For each data - point $x_i$, calculate $(x_i-\bar{x})^2$. For example, for $x_1 = 284$, $(284 - 282.53)^2=(1.47)^2 = 2.1609$. Do this for all 15 data - points and sum them up. $\sum_{i = 1}^{15}(x_i-\bar{x})^2=(284 - 282.53)^2+(276 - 282.53)^2+(286 - 282.53)^2+(288 - 282.53)^2+(276 - 282.53)^2+(285 - 282.53)^2+(288 - 282.53)^2+(293 - 282.53)^2+(275 - 282.53)^2+(285 - 282.53)^2+(289 - 282.53)^2+(289 - 282.53)^2+(291 - 282.53)^2+(276 - 282.53)^2+(277 - 282.53)^2$ $=2.1609 + 42.6409+11.9709 + 29.9209+42.6409+6.1009+29.9209+109.6209+56.7009+6.1009+41.8609+41.8609+71.7409+42.6409+30.5809$ $=466.7355$.
Step3: Calculate the variance
The variance $s^2=\frac{\sum_{i = 1}^{n}(x_i-\bar{x})^2}{n - 1}=\frac{466.7355}{14}\approx33.33825$.
Step4: Calculate the standard deviation
The standard deviation $s=\sqrt{s^2}=\sqrt{33.33825}\approx5.8$.
Answer:
$5.8$