a set of data is collected, pairing family size with average monthly cost of groceries. using the least…
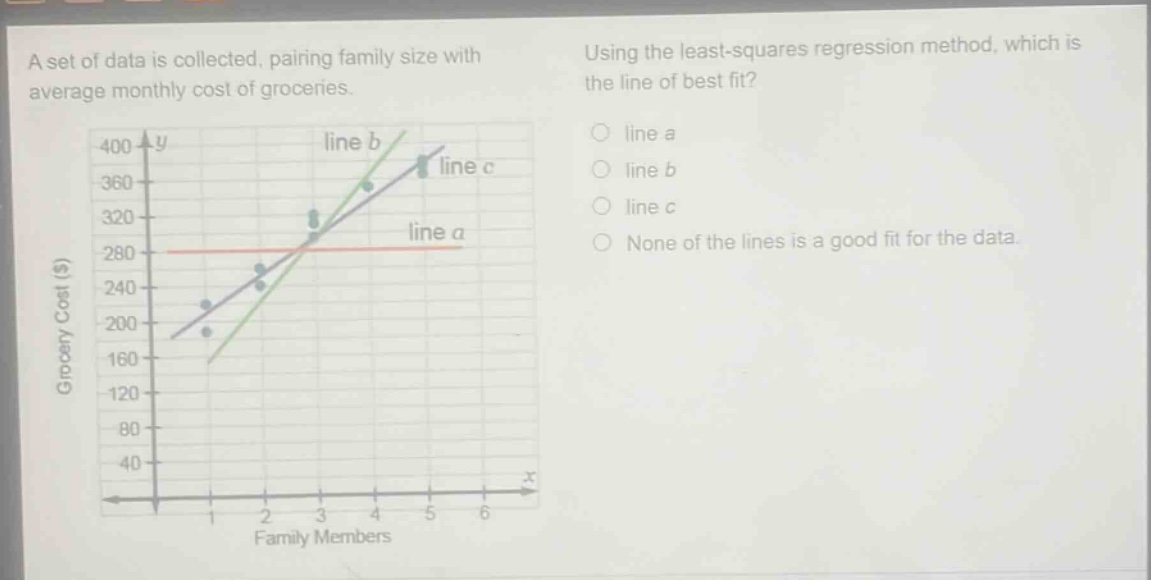
a set of data is collected, pairing family size with average monthly cost of groceries. using the least - squares regression method, which is the line of best fit? line a line b line c none of the lines is a good fit for the data.
Answer
Explanation:
Step1: Understand least - squares regression
The least - squares regression line minimizes the sum of the squared vertical distances between the data points and the line.
Step2: Analyze the lines
Line a is a horizontal line and does not capture the upward trend of the data. Line b is too steep compared to the general trend of the data points. Line c appears to pass through the middle of the data points and best represents the overall upward trend as family size increases and grocery cost increases.
Answer:
line c