a set of data is represented using a semi - log plot (not shown), in which the vertical axis is…
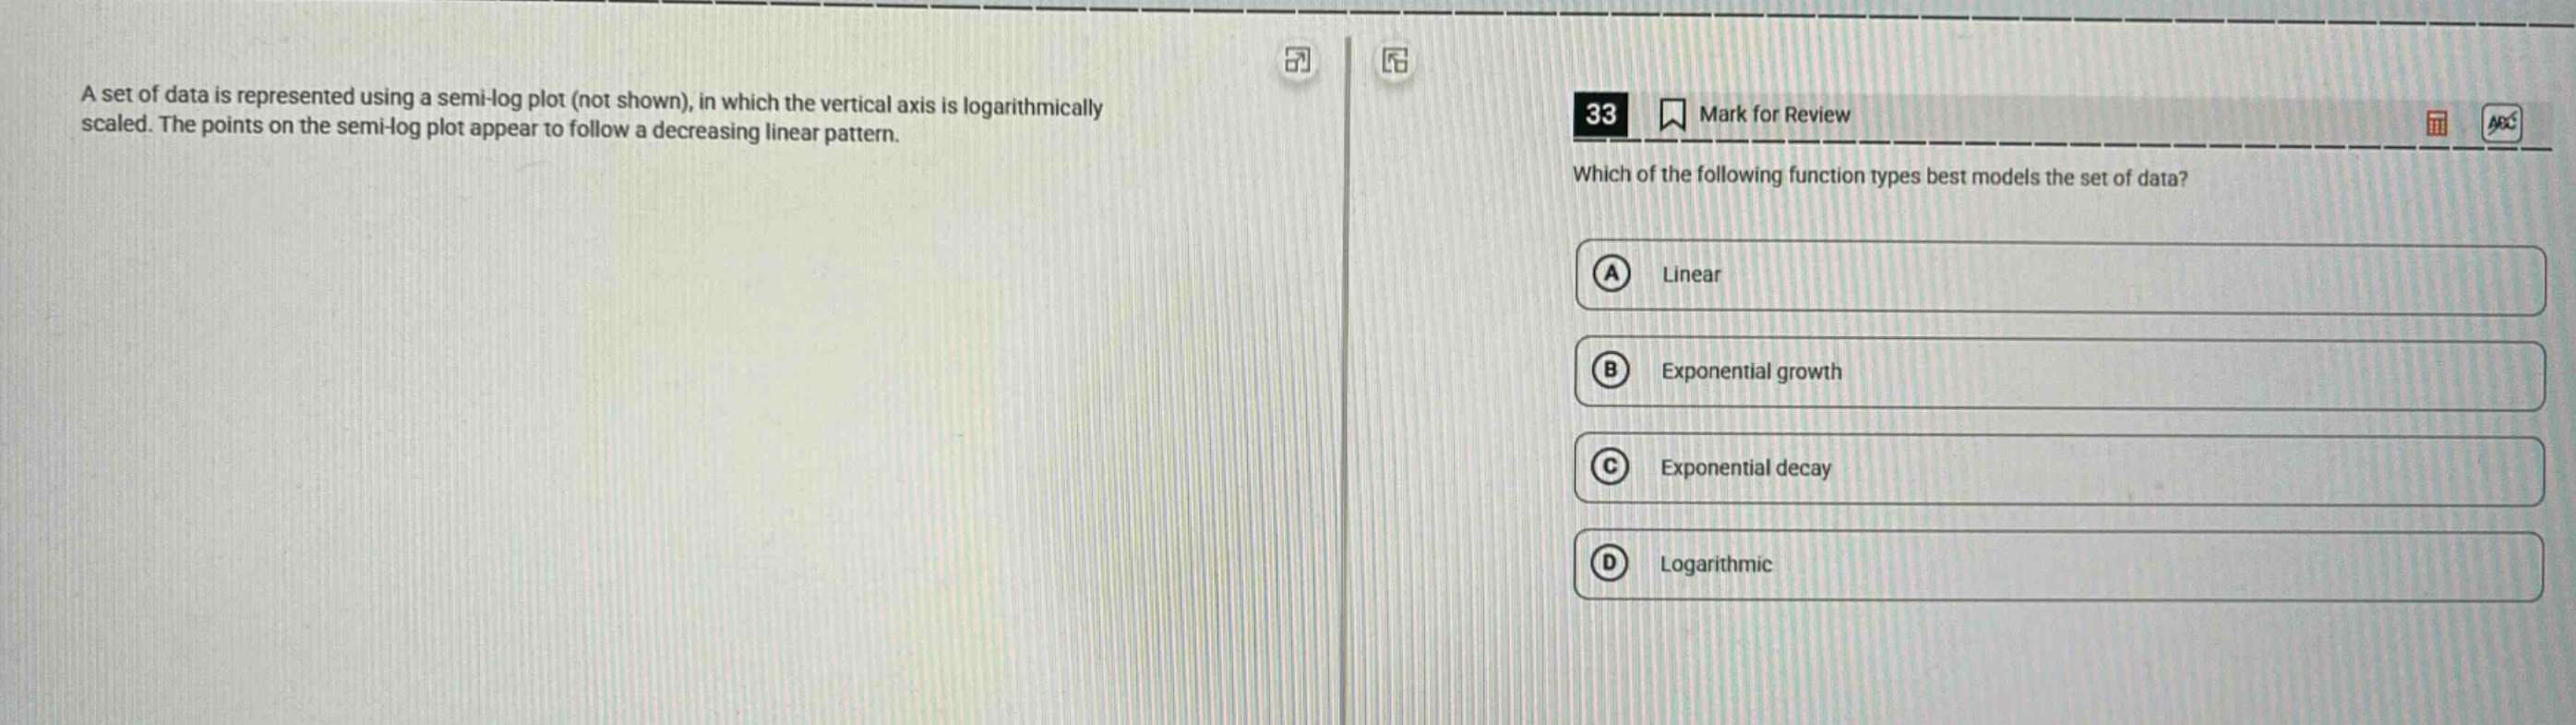
a set of data is represented using a semi - log plot (not shown), in which the vertical axis is logarithmically scaled. the points on the semi - log plot appear to follow a decreasing linear pattern. 33 mark for review which of the following function types best models the set of data? a linear b exponential growth c exponential decay d logarithmic
Answer
Explanation:
Step1: Recall semi - log plot property
If $y = a\cdot b^{x}$ (exponential function), taking the natural logarithm of both sides gives $\ln(y)=\ln(a)+x\ln(b)$. On a semi - log plot (logarithmic vertical axis, linear horizontal axis), an exponential function $y = a\cdot b^{x}$ will appear as a linear function.
Step2: Analyze the pattern
Since the points on the semi - log plot follow a decreasing linear pattern, and for an exponential function $y = a\cdot b^{x}$, when $0 < b<1$, it represents exponential decay and $\ln(y)=\ln(a)+x\ln(b)$ has a negative slope (because $\ln(b)<0$ when $0 < b < 1$).
Answer:
C. Exponential decay