several students were selected to participate in a two - question survey. they were asked if they prefer a…
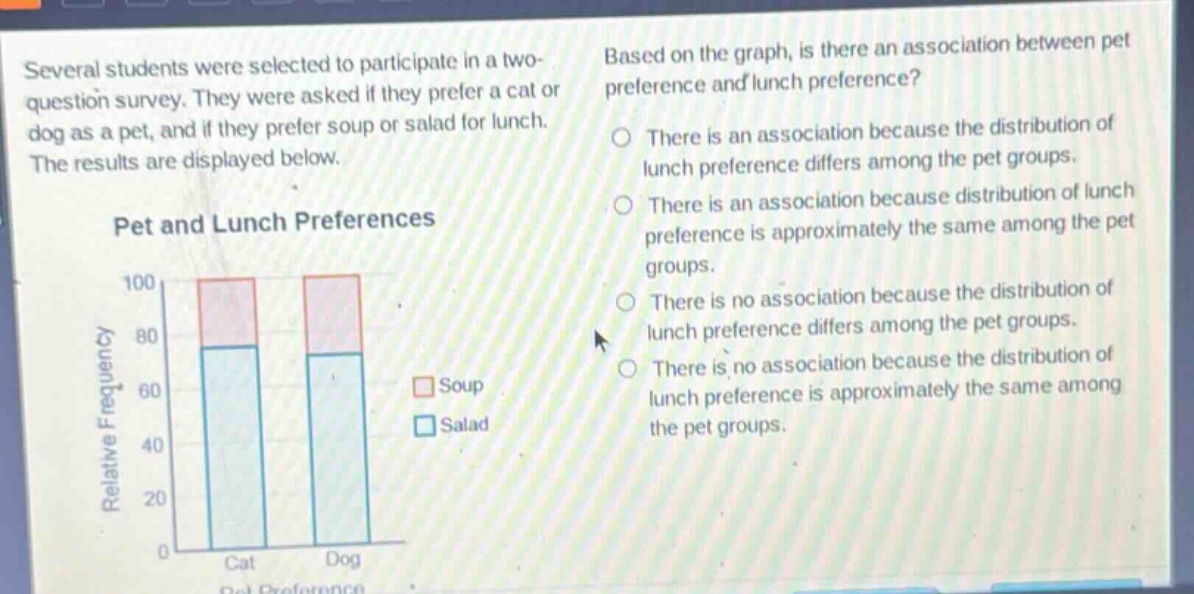
several students were selected to participate in a two - question survey. they were asked if they prefer a cat or dog as a pet, and if they prefer soup or salad for lunch. the results are displayed below. pet and lunch preferences based on the graph, is there an association between pet preference and lunch preference? there is an association because the distribution of lunch preference differs among the pet groups. there is an association because distribution of lunch preference is approximately the same among the pet groups. there is no association because the distribution of lunch preference differs among the pet groups. there is no association because the distribution of lunch preference is approximately the same among the pet groups.
Answer
Explanation:
Step1: Understand association concept
Association exists when the distribution of one variable (lunch preference) differs among levels of another variable (pet preference).
Step2: Analyze the graph
In the graph, the proportion of salad - soup preferences is different for cat - lovers and dog - lovers. For example, the relative frequency of salad and soup is not the same in the cat and dog groups.
Answer:
There is an association because the distribution of lunch preference differs among the pet groups.