the shape of this graph is best described as skewed. complete based on the shape of the graph, what is the…
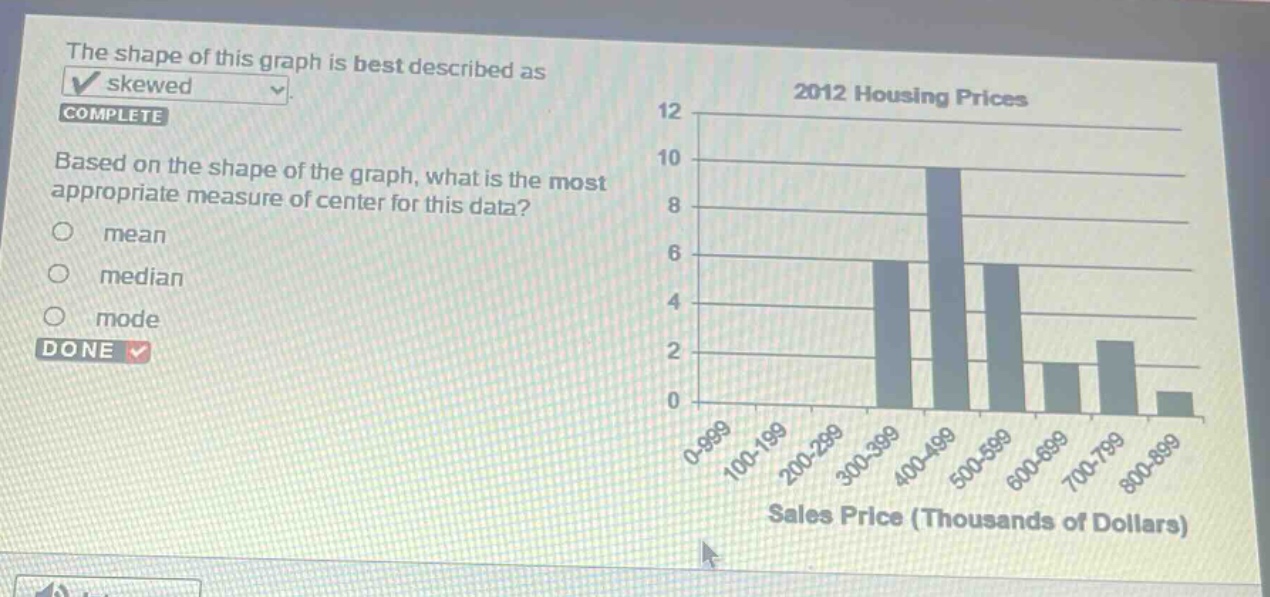
the shape of this graph is best described as skewed. complete based on the shape of the graph, what is the most appropriate measure of center for this data? mean median mode done 2012 housing prices 12 10 8 6 4 2 0 0 - 999 100 - 199 200 - 299 300 - 399 400 - 499 500 - 599 600 - 699 700 - 799 800 - 899 sales price (thousands of dollars)
Answer
Brief Explanations:
When data is skewed, the median is a better measure of the center than the mean because the mean is affected by extreme values. The mode represents the most frequent value and may not represent the center well in skewed - data.
Answer:
median