the shape of this graph is best described as\nsymmetric\nskewed\nconstant\npeaks and valleys\n2012 housing…
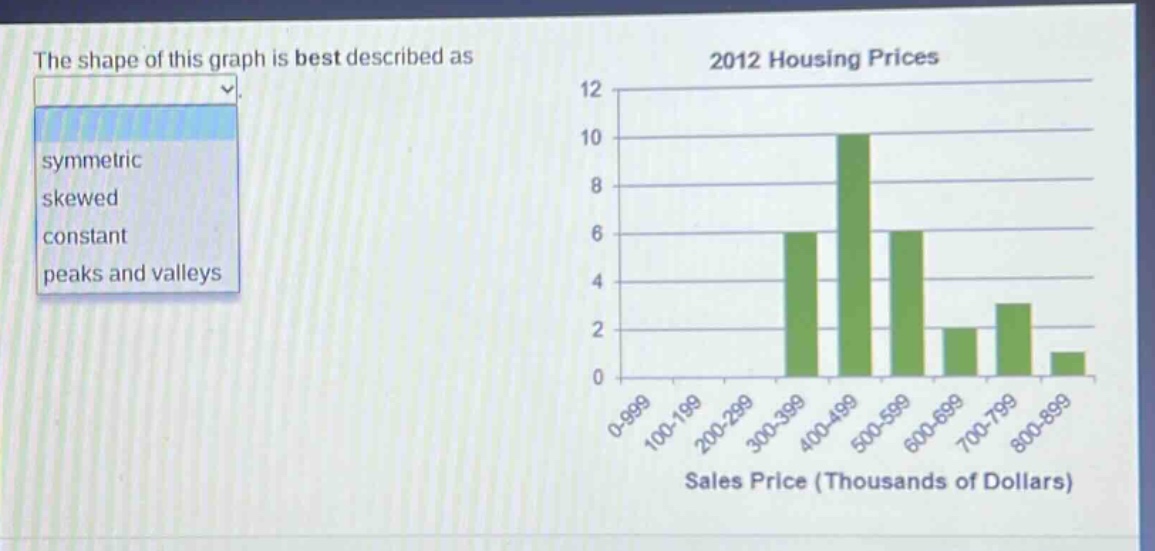
the shape of this graph is best described as\nsymmetric\nskewed\nconstant\npeaks and valleys\n2012 housing prices\nsales price (thousands of dollars)
Answer
Brief Explanations:
A symmetric graph has equal - shaped halves on either side of a central point. A skewed graph has a long tail on one side. A constant graph has the same value across all intervals. Peaks and valleys refer to high and low points. The given histogram is not symmetric as the left and right sides are not mirror - images. It is not constant as the frequencies vary. It does not have distinct peaks and valleys. It is skewed as it has a long tail on the right side.
Answer:
skewed