sharona recorded the number of gray hairs her coworkers have and their ages in the graph below. which of the…
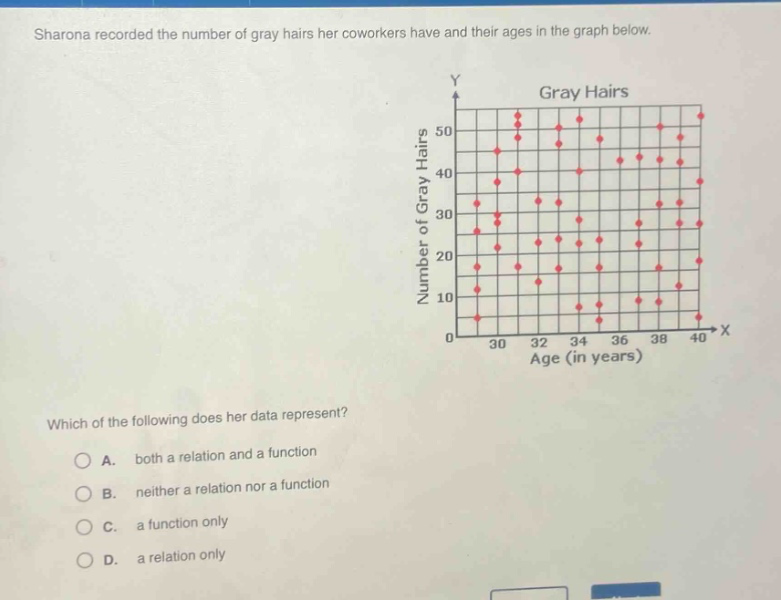
sharona recorded the number of gray hairs her coworkers have and their ages in the graph below. which of the following does her data represent? a. both a relation and a function b. neither a relation nor a function c. a function only d. a relation only
Answer
Explanation:
Step1: Define relation and function
A relation is a set of ordered - pairs. A function is a relation where each input (x - value) has exactly one output (y - value).
Step2: Analyze the data
The graph shows pairs of values where the x - values are ages and the y - values are the number of gray hairs. This is a set of ordered - pairs, so it is a relation.
Step3: Check for function
For some age values (x - values), there are multiple values of the number of gray hairs (y - values). For example, at age 30, there are different numbers of gray hairs for different coworkers. So, each input (age) does not have exactly one output (number of gray hairs), and it is not a function.
Answer:
D. a relation only