shelby gathered data from different schools about the number of hours students spend doing homework per…
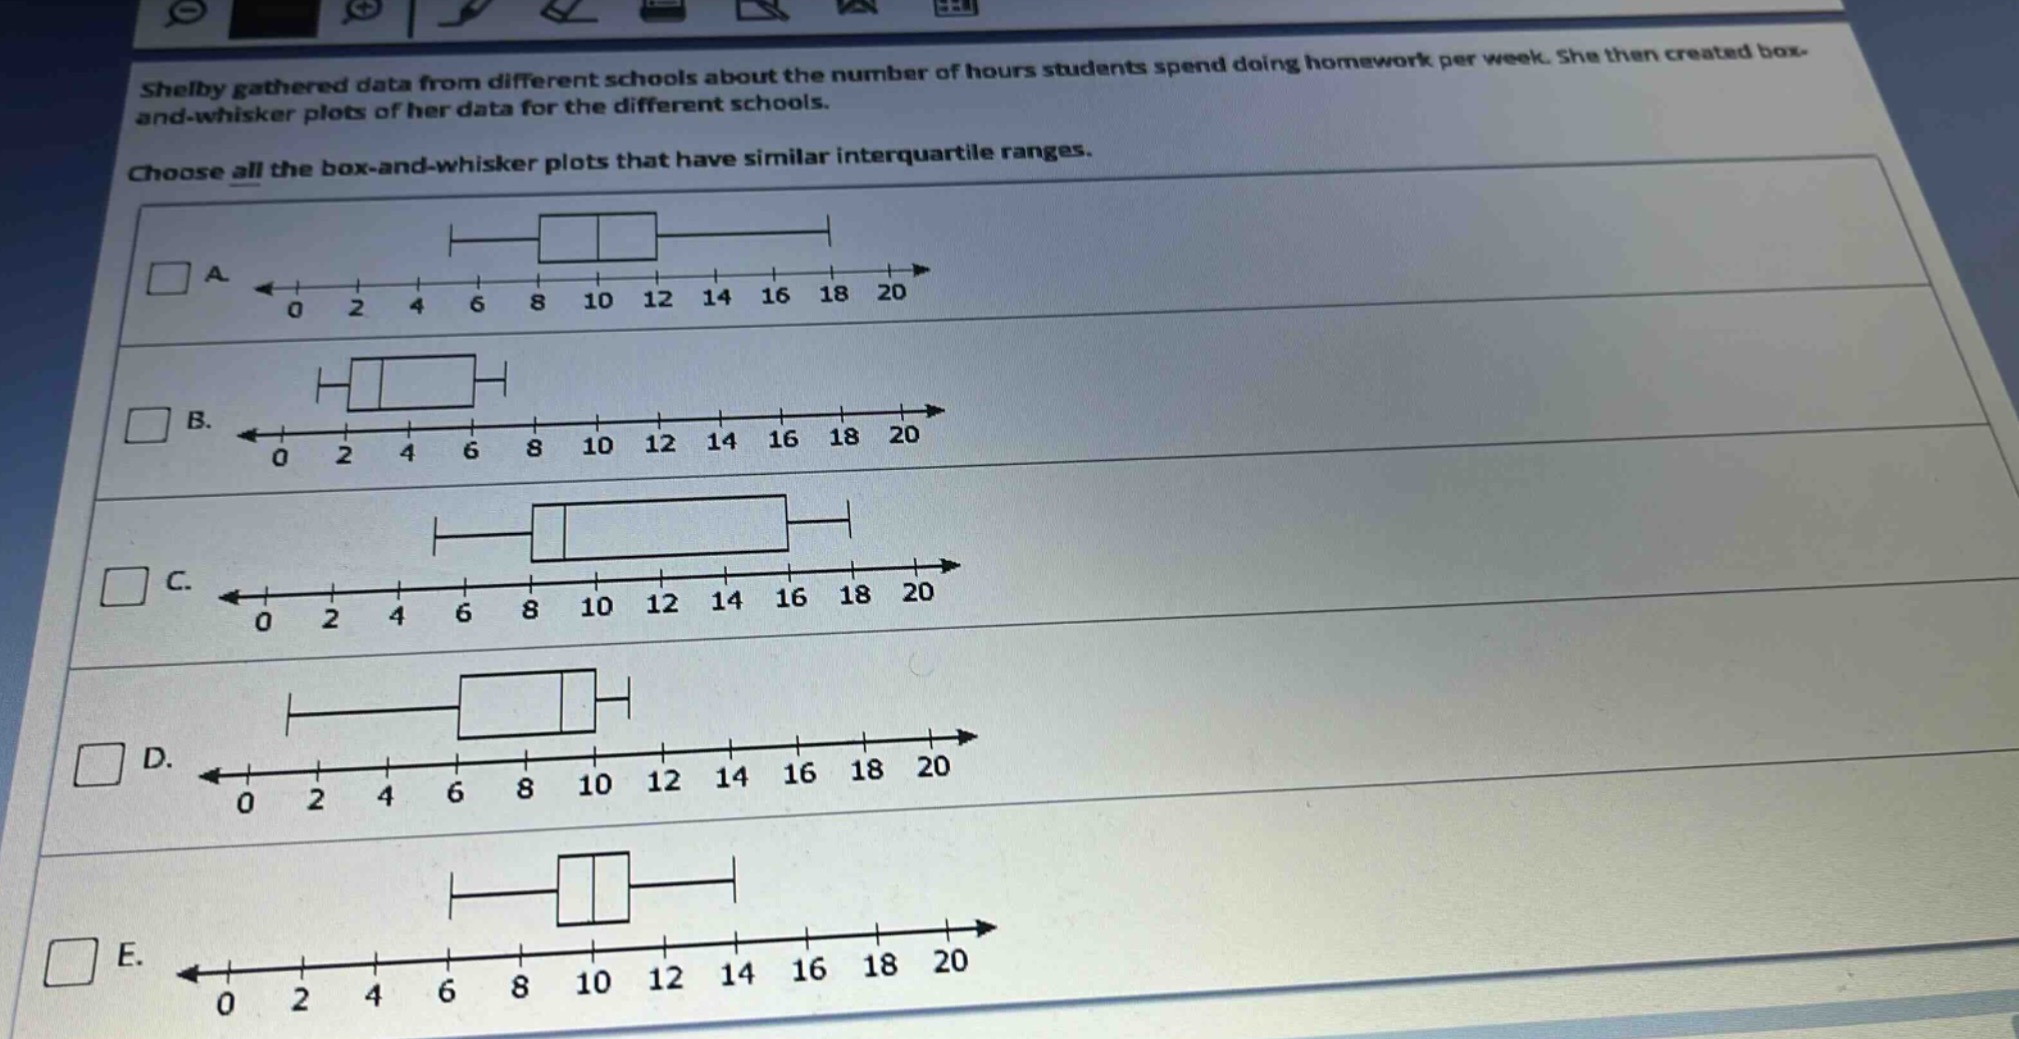
shelby gathered data from different schools about the number of hours students spend doing homework per week. she then created box - and - whisker plots of her data for the different schools. choose all the box - and - whisker plots that have similar interquartile ranges.
Answer
Explanation:
The interquartile range (IQR) is the difference between the third quartile (Q3) and the first quartile (Q1). In a box-and-whisker plot, Q1 is the left edge of the box and Q3 is the right edge of the box. We need to calculate the IQR for each plot and identify those with similar IQRs.
Step1: Calculate IQR for Plot A
Q1 is at 8 and Q3 is at 12. $$IQR_A = Q3 - Q1 = 12 - 8 = 4$$
Step2: Calculate IQR for Plot B
Q1 is at 2 and Q3 is at 6. $$IQR_B = Q3 - Q1 = 6 - 2 = 4$$
Step3: Calculate IQR for Plot C
Q1 is at 8 and Q3 is at 16. $$IQR_C = Q3 - Q1 = 16 - 8 = 8$$
Step4: Calculate IQR for Plot D
Q1 is at 6 and Q3 is at 10. $$IQR_D = Q3 - Q1 = 10 - 6 = 4$$
Step5: Calculate IQR for Plot E
Q1 is at 9 and Q3 is at 12. $$IQR_E = Q3 - Q1 = 12 - 9 = 3$$
Step6: Identify plots with similar IQRs
Comparing the IQRs: $IQR_A = 4$ $IQR_B = 4$ $IQR_C = 8$ $IQR_D = 4$ $IQR_E = 3$ Plots A, B, and D have an IQR of 4.
Answer:
A. B. D.