show your work question.\nthe mean height of students at a particular school is 54 inches with a standard…
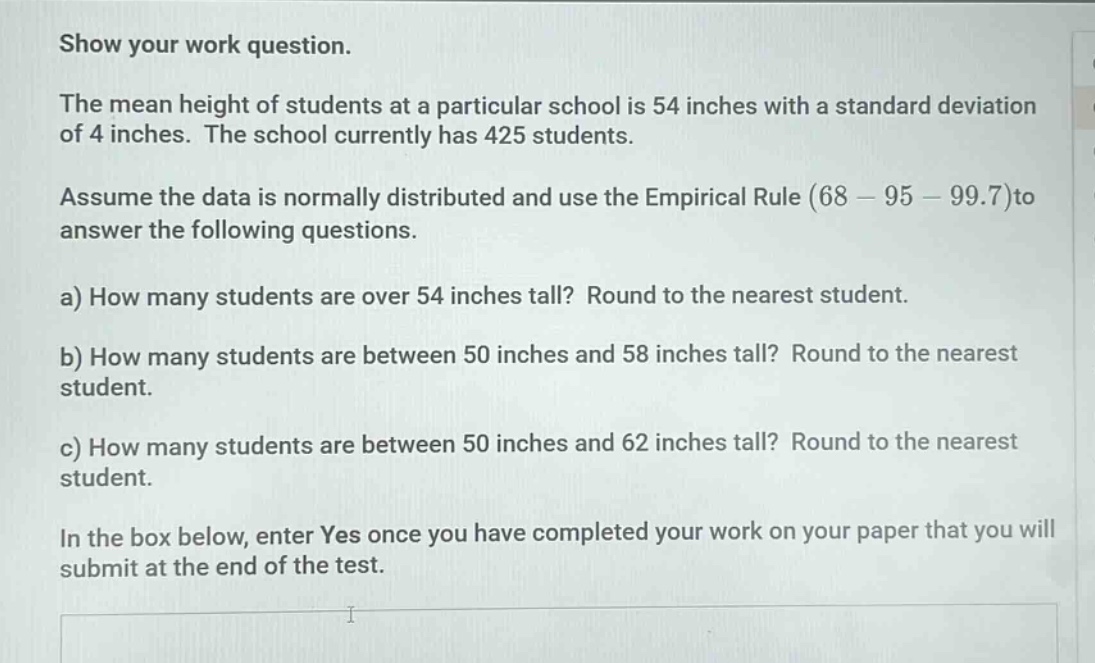
show your work question.\nthe mean height of students at a particular school is 54 inches with a standard deviation of 4 inches. the school currently has 425 students.\nassume the data is normally distributed and use the empirical rule (68 - 95 - 99.7)to answer the following questions.\na) how many students are over 54 inches tall? round to the nearest student.\nb) how many students are between 50 inches and 58 inches tall? round to the nearest student.\nc) how many students are between 50 inches and 62 inches tall? round to the nearest student.\nin the box below, enter yes once you have completed your work on your paper that you will submit at the end of the test.
Answer
Explanation:
Step1: Recall properties of normal distribution
In a normal - distribution, the mean divides the data into two equal halves. So the proportion of data above the mean is 0.5.
Step2: Calculate number of students over 54 inches
The total number of students is $n = 425$. The number of students over 54 inches is $0.5\times425=212.5\approx213$.
Step3: Identify range for part b
The range $50$ to $58$ inches is $\mu\pm\sigma$, where $\mu = 54$ (mean) and $\sigma = 4$ (standard - deviation). By the Empirical Rule, the proportion of data within $\mu\pm\sigma$ is 0.68.
Step4: Calculate number of students between 50 and 58 inches
The number of students between 50 and 58 inches is $0.68\times425 = 289$.
Step5: Identify range for part c
The range $50$ to $62$ inches is $\mu\pm2\sigma$. By the Empirical Rule, the proportion of data within $\mu\pm2\sigma$ is 0.95.
Step6: Calculate number of students between 50 and 62 inches
The number of students between 50 and 62 inches is $0.95\times425=403.75\approx404$.
Answer:
a) 213 b) 289 c) 404