shown below are the scatter plots for four data sets. answer the questions that follow. (a) choose the data…
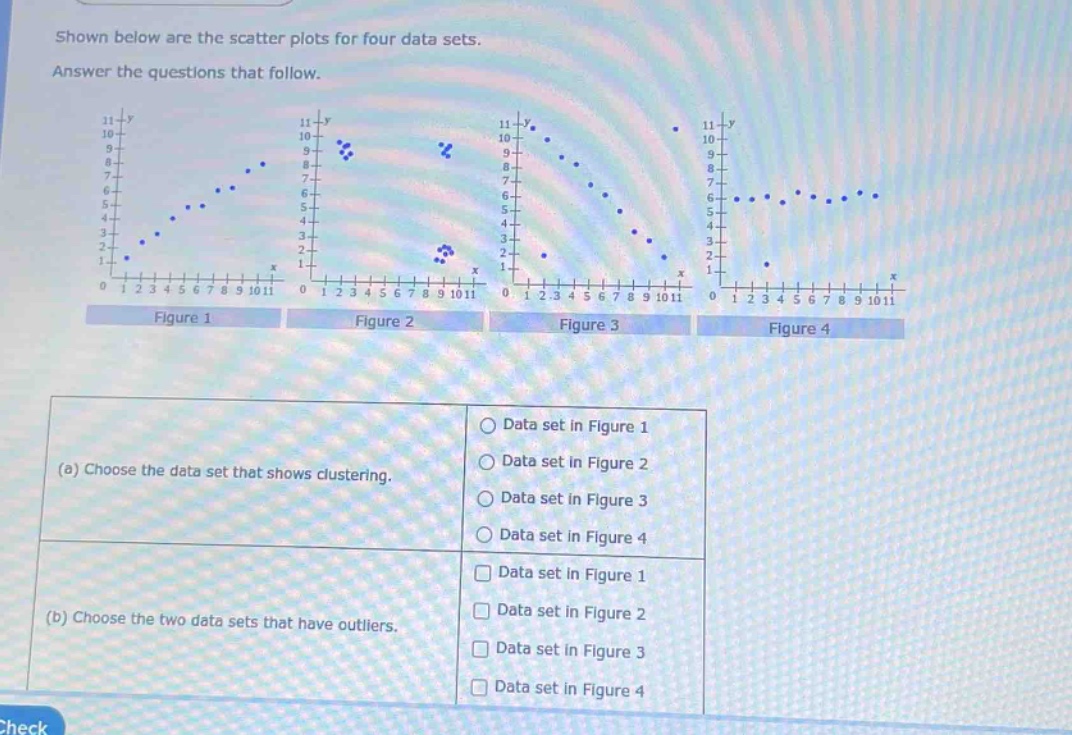
shown below are the scatter plots for four data sets. answer the questions that follow. (a) choose the data set that shows clustering. data set in figure 1 data set in figure 2 data set in figure 3 data set in figure 4 (b) choose the two data sets that have outliers. data set in figure 1 data set in figure 2 data set in figure 3 data set in figure 4
Answer
Explanation:
Step1: Understand clustering
Clustering is when data - points group together. In Figure 2, we can see groups of points, indicating clustering.
Step2: Understand outliers
Outliers are data - points that are far from the rest of the data. In Figure 2, there are points away from the main clusters, and in Figure 3, there is a point far from the main set of points.
Answer:
(a) Data set in Figure 2 (b) Data set in Figure 2, Data set in Figure 3