shown below are the scatter plots for four data sets. answer the questions that follow. (a) which data set…
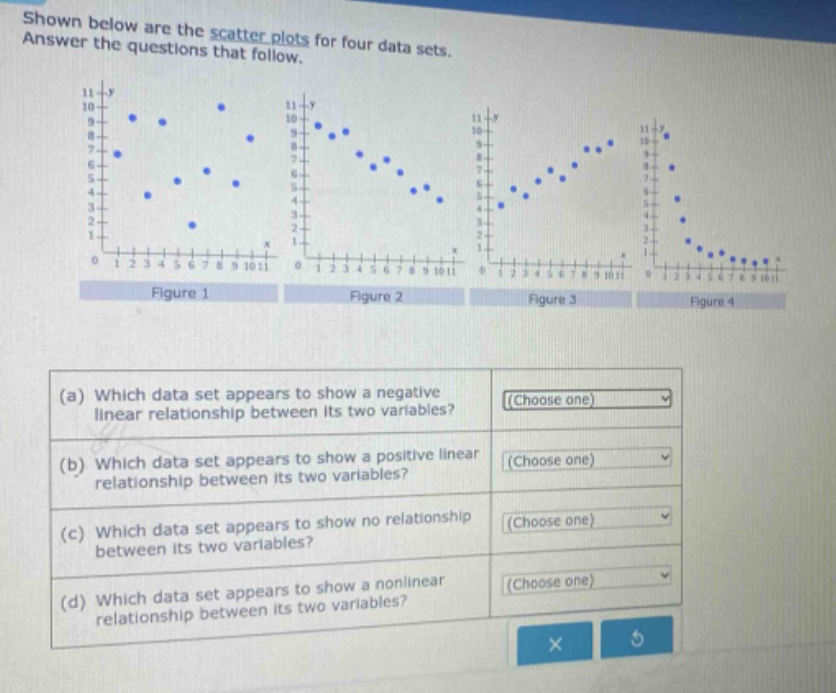
shown below are the scatter plots for four data sets. answer the questions that follow. (a) which data set appears to show a negative linear relationship between its two variables? (choose one) (b) which data set appears to show a positive linear relationship between its two variables? (choose one) (c) which data set appears to show no relationship between its two variables? (choose one) (d) which data set appears to show a nonlinear relationship between its two variables? (choose one)
Answer
Explanation:
Step1: Analyze negative linear relationship
In a negative - linear relationship, as one variable increases, the other decreases in a linear fashion. In Figure 2, the points generally move downwards from left to right, indicating a negative linear relationship.
Step2: Analyze positive linear relationship
In a positive - linear relationship, as one variable increases, the other also increases in a linear fashion. In Figure 3, the points generally move upwards from left to right, indicating a positive linear relationship.
Step3: Analyze no relationship
In a data - set with no relationship, the points are scattered randomly with no discernible pattern. In Figure 1, the points are randomly distributed, showing no relationship.
Step4: Analyze nonlinear relationship
In a nonlinear relationship, the points do not follow a straight - line pattern. In Figure 4, the points follow a curved pattern, indicating a nonlinear relationship.
Answer:
(a) Figure 2 (b) Figure 3 (c) Figure 1 (d) Figure 4