shown below are the scatter - plots for four data sets. answer the questions that follow. (a) which data set…
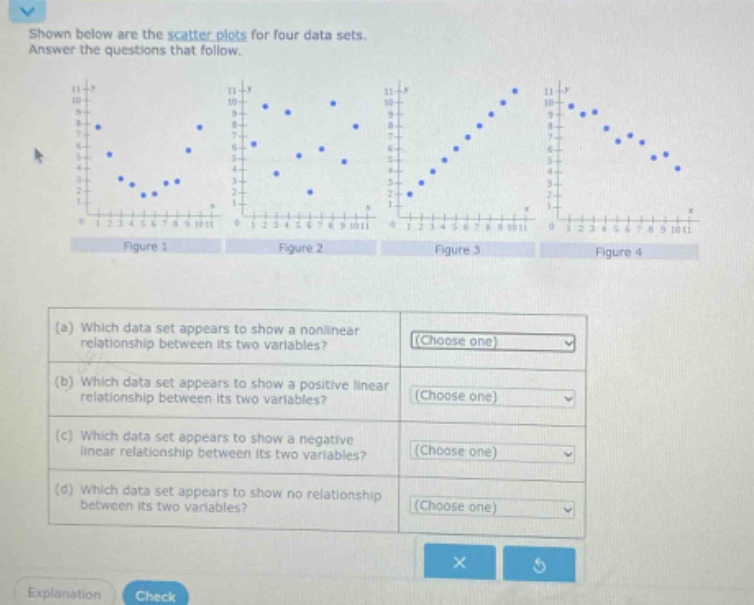
shown below are the scatter - plots for four data sets. answer the questions that follow. (a) which data set appears to show a nonlinear relationship between its two variables? (choose one) (b) which data set appears to show a positive linear relationship between its two variables? (choose one) (c) which data set appears to show a negative linear relationship between its two variables? (choose one) (d) which data set appears to show no relationship between its two variables? (choose one)
Answer
Explanation:
Step1: Analyze nonlinear relationship
In a nonlinear relationship, the data points do not follow a straight - line pattern. Figure 1 shows a U - shaped pattern, which is nonlinear.
Step2: Analyze positive linear relationship
In a positive linear relationship, as one variable increases, the other variable also increases in a linear fashion. Figure 3 shows data points that generally move upwards from left to right in a linear way.
Step3: Analyze negative linear relationship
In a negative linear relationship, as one variable increases, the other variable decreases in a linear fashion. Figure 4 shows data points that generally move downwards from left to right in a linear way.
Step4: Analyze no relationship
In a data set with no relationship, the data points are scattered randomly with no discernible pattern. Figure 2 has data points that seem to be randomly placed with no clear upward, downward or curved trend.
Answer:
(a) Figure 1 (b) Figure 3 (c) Figure 4 (d) Figure 2